2011 Annual Report - OTCIQ.com
2011 Annual Report - OTCIQ.com
2011 Annual Report - OTCIQ.com

You also want an ePaper? Increase the reach of your titles
YUMPU automatically turns print PDFs into web optimized ePapers that Google loves.
42 Corporate Sustainability<br />
In recent years, society’s expectations towards the energy<br />
industry have increased. Our stakeholders expect us to operate<br />
our businesses responsibly and sustainably. At the same time,<br />
we face greater challenges, like finding answers to climate<br />
change and sustainable solutions for the energy supply system<br />
of the future. E.ON’s new strategy, cleaner & better energy,<br />
addresses these <strong>com</strong>plex demands. In line with this strategy,<br />
in <strong>2011</strong> we designed a new sustainability program that focuses<br />
on further embedding sustainability criteria (such as environmental<br />
protection, occupational safety, and corporate governance)<br />
into key business areas. In dialog with various stakeholders,<br />
we have set long-term targets, which we describe in<br />
our Sustainability <strong>Report</strong>. This annual publication also explains<br />
our key focus areas and reports on the latest developments.<br />
It is only by reporting on our performance transparently and<br />
by continually engaging our stakeholders that we will engender<br />
the trust and acceptance that we need to ensure the longterm<br />
success of our business.<br />
Our successes in <strong>2011</strong> included reducing our accident rate and<br />
promoting responsible fuel procurement by cofounding the<br />
Better Coal initiative. We were again included in the Dow Jones<br />
Sustainability Index, which underscores our performance as<br />
a sustainability-oriented <strong>com</strong>pany. More information about our<br />
sustainability efforts is available at www.eon.<strong>com</strong>, where<br />
you will also find our new Sustainability <strong>Report</strong>, which will be<br />
released in May 2012.<br />
Emissions data for our power and heat generation are segmented<br />
by country in accordance with the EU Emissions<br />
Trading Scheme. This differs from the segmentation for the<br />
rest of our reporting.<br />
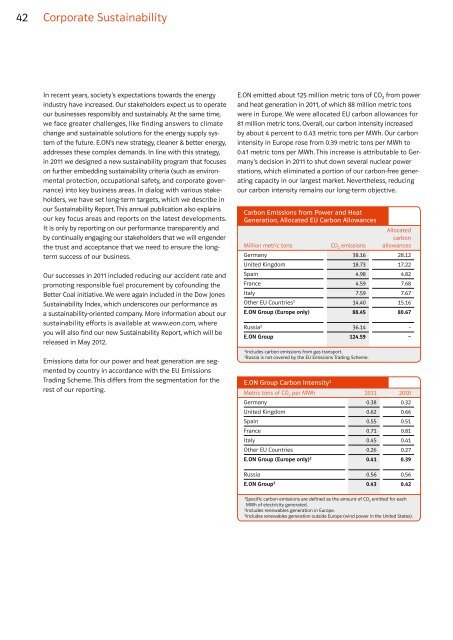
E.ON emitted about 125 million metric tons of CO 2 from power<br />
and heat generation in <strong>2011</strong>, of which 88 million metric tons<br />
were in Europe. We were allocated EU carbon allowances for<br />
81 million metric tons. Overall, our carbon intensity increased<br />
by about 4 percent to 0.43 metric tons per MWh. Our carbon<br />
intensity in Europe rose from 0.39 metric tons per MWh to<br />
0.41 metric tons per MWh. This increase is attributable to Germany’s<br />
decision in <strong>2011</strong> to shut down several nuclear power<br />
stations, which eliminated a portion of our carbon-free generating<br />
capacity in our largest market. Nevertheless, reducing<br />
our carbon intensity remains our long-term objective.<br />
Carbon Emissions from Power and Heat<br />
Generation, Allocated EU Carbon Allowances<br />
Million metric tons CO2 emissions<br />
Allocated<br />
carbon<br />
allowances<br />
Germany 38.16 28.12<br />
United Kingdom 18.73 17.22<br />
Spain 4.98 4.82<br />
France 4.59 7.68<br />
Italy 7.59 7.67<br />
Other EU Countries1 14.40 15.16<br />
E.ON Group (Europe only) 88.45 80.67<br />
Russia2 36.14 –<br />
E.ON Group 124.59 –<br />
1 Includes carbon emissions from gas transport.<br />
2 Russia is not covered by the EU Emissions Trading Scheme.<br />
E.ON Group Carbon Intensity1 Metric tons of CO2 per MWh <strong>2011</strong> 2010<br />
Germany 0.38 0.32<br />
United Kingdom 0.62 0.66<br />
Spain 0.55 0.51<br />
France 0.71 0.81<br />
Italy 0.45 0.41<br />
Other EU Countries 0.26 0.27<br />
E.ON Group (Europe only) 2 0.41 0.39<br />
Russia 0.56 0.56<br />
E.ON Group3 0.43 0.42<br />
1 Specific carbon emissions are defined as the amount of CO2 emitted for each<br />
MWh of electricity generated.<br />
2 Includes renewables generation in Europe.<br />
3 Includes renewables generation outside Europe (wind power in the United States).