2011 Annual Report - OTCIQ.com
2011 Annual Report - OTCIQ.com
2011 Annual Report - OTCIQ.com

Create successful ePaper yourself
Turn your PDF publications into a flip-book with our unique Google optimized e-Paper software.
Cash Flow and Financial Position<br />
E.ON presents its financial condition using, among other<br />
financial measures, cash provided by operating activities of<br />
continuing operations and economic net debt.<br />
At €6.6 billion, our cash provided by operating activities of<br />
continuing operations was considerably below the prior-year<br />
figure of €10.6 billion. The main reasons for the decline were<br />
cash-effective items in conjunction with the decrease in EBITDA,<br />
a non-recurring adverse effect relating to the refunding of<br />
pension assets in the United Kingdom, and negative workingcapital<br />
effects. The main negative factors for the latter item<br />
were lower subsidy payments for new wind farms in the United<br />
States, portfolio effects, higher interest payments, and changes<br />
in working capital at Trading and Gas and at certain regional<br />
units. Lower tax payments had a positive effect.<br />
Cash provided by investing activities of continuing operations<br />
amounted to about -€3.1 billion in <strong>2011</strong> (prior year: €1.1 billion).<br />
Investment expenditures on property, plant, and equipment<br />
were lower, as were the proceeds from the sale of equity interests.<br />
In addition, significantly more cash was invested in securities<br />
and fixed-term deposits than in the prior year.<br />
Cash provided by financing activities of continuing operations<br />
of -€5.8 billion (prior year: -€9.9 billion) primarily reflects<br />
the net repayment of financial liabilities and E.ON’s again high<br />
dividend payment.<br />
Compared with the figure recorded at December 31, 2010<br />
(-€37,701 million), our economic net debt improved by €1,316 million<br />
to -€36,385 million. The main reasons for the improvement<br />
were the sale of Central Networks and the sale of the<br />
second tranche of Gazprom stock. Along with these disposal<br />
proceeds, our cash provided by operating activities exceeded<br />
our investments in property, plant, and equipment. E.ON AG’s<br />
dividend payout had an adverse effect on our economic net<br />
debt. The increase in provisions for nuclear waste management<br />
was due in part to the amendment of Germany’s Nuclear<br />
Energy Act.<br />
CEO Letter<br />
E.ON Stock<br />
Combined Group Management <strong>Report</strong><br />
Consolidated Financial Statements<br />
Corporate Governance <strong>Report</strong><br />
Supervisory Board and Board of Management<br />
Tables and Explanations<br />
The calculation of economic net debt includes the fair value<br />
(net) of currency derivatives used for financing transactions<br />
(but excluding transactions relating to our operating business<br />
and asset management) in order to also reflect the foreigncurrency<br />
effects of financial transactions which, for accounting<br />
reasons, would not be included in the <strong>com</strong>ponents of net<br />
financial position.<br />
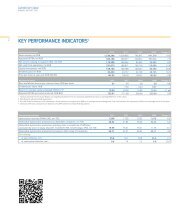
Economic Net Debt<br />
€ in millions<br />
December 31<br />
<strong>2011</strong> 2010<br />
Liquid funds 7,020 8,273<br />
Non-current securities<br />
Total liquid funds and non-current<br />
4,904 3,903<br />
securities 11,924 12,176<br />
Financial liabilities to banks and third<br />
parties<br />
Financial liabilities resulting from<br />
interests in associated <strong>com</strong>panies and<br />
-28,490 -31,799<br />
other shareholdings -1,424 -692<br />
Total financial liabilities -29,914 -32,491<br />
Net financial position -17,990 -20,315<br />
Fair value (net) of currency derivatives<br />
used for financing transactions1 524 334<br />
Provisions for pensions -3,245 -3,250<br />
Asset-retirement obligations<br />
Less prepayments to Swedish nuclear<br />
-17,269 -15,968<br />
fund 1,595 1,498<br />
Economic net debt -36,385 -37,701<br />
EBITDA2 9,293 13,346<br />
Debt factor 3.9 2.8<br />
1 Does not include transactions relating to our operating business or asset<br />
management.<br />
2 Adjusted for extraordinary effects.<br />
Our debt factor was 3.9 at year-end <strong>2011</strong> (prior year: 2.8).<br />
However, this was predominantly attributable to largely noncash-effective,<br />
non-recurring items resulting from Germany’s<br />
accelerated phaseout of nuclear energy. Adjusted for these<br />
effects, our debt factor was 3.4.<br />
37