national wetland atlas assam - Ministry of Environment and Forests
national wetland atlas assam - Ministry of Environment and Forests
national wetland atlas assam - Ministry of Environment and Forests

You also want an ePaper? Increase the reach of your titles
YUMPU automatically turns print PDFs into web optimized ePapers that Google loves.
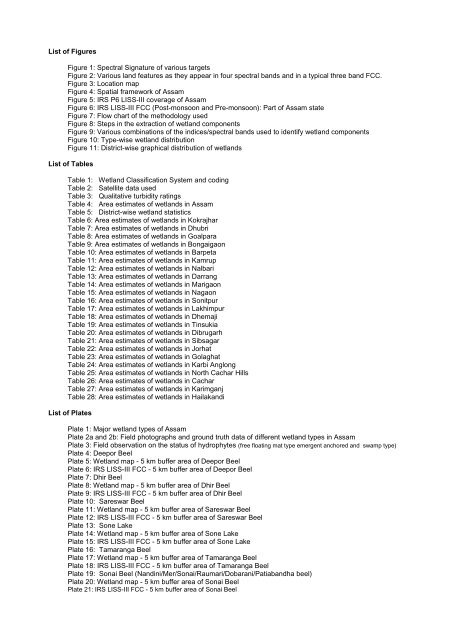
List <strong>of</strong> Figures<br />
Figure 1: Spectral Signature <strong>of</strong> various targets<br />
Figure 2: Various l<strong>and</strong> features as they appear in four spectral b<strong>and</strong>s <strong>and</strong> in a typical three b<strong>and</strong> FCC.<br />
Figure 3: Location map<br />
Figure 4: Spatial framework <strong>of</strong> Assam<br />
Figure 5: IRS P6 LISS-III coverage <strong>of</strong> Assam<br />
Figure 6: IRS LISS-III FCC (Post-monsoon <strong>and</strong> Pre-monsoon): Part <strong>of</strong> Assam state<br />
Figure 7: Flow chart <strong>of</strong> the methodology used<br />
Figure 8: Steps in the extraction <strong>of</strong> <strong>wetl<strong>and</strong></strong> components<br />
Figure 9: Various combinations <strong>of</strong> the indices/spectral b<strong>and</strong>s used to identify <strong>wetl<strong>and</strong></strong> components<br />
Figure 10: Type-wise <strong>wetl<strong>and</strong></strong> distribution<br />
Figure 11: District-wise graphical distribution <strong>of</strong> <strong>wetl<strong>and</strong></strong>s<br />
List <strong>of</strong> Tables<br />
Table 1: Wetl<strong>and</strong> Classification System <strong>and</strong> coding<br />
Table 2: Satellite data used<br />
Table 3: Qualitative turbidity ratings<br />
Table 4: Area estimates <strong>of</strong> <strong>wetl<strong>and</strong></strong>s in Assam<br />
Table 5: District-wise <strong>wetl<strong>and</strong></strong> statistics<br />
Table 6: Area estimates <strong>of</strong> <strong>wetl<strong>and</strong></strong>s in Kokrajhar<br />
Table 7: Area estimates <strong>of</strong> <strong>wetl<strong>and</strong></strong>s in Dhubri<br />
Table 8: Area estimates <strong>of</strong> <strong>wetl<strong>and</strong></strong>s in Goalpara<br />
Table 9: Area estimates <strong>of</strong> <strong>wetl<strong>and</strong></strong>s in Bongaigaon<br />
Table 10: Area estimates <strong>of</strong> <strong>wetl<strong>and</strong></strong>s in Barpeta<br />
Table 11: Area estimates <strong>of</strong> <strong>wetl<strong>and</strong></strong>s in Kamrup<br />
Table 12: Area estimates <strong>of</strong> <strong>wetl<strong>and</strong></strong>s in Nalbari<br />
Table 13: Area estimates <strong>of</strong> <strong>wetl<strong>and</strong></strong>s in Darrang<br />
Table 14: Area estimates <strong>of</strong> <strong>wetl<strong>and</strong></strong>s in Marigaon<br />
Table 15: Area estimates <strong>of</strong> <strong>wetl<strong>and</strong></strong>s in Nagaon<br />
Table 16: Area estimates <strong>of</strong> <strong>wetl<strong>and</strong></strong>s in Sonitpur<br />
Table 17: Area estimates <strong>of</strong> <strong>wetl<strong>and</strong></strong>s in Lakhimpur<br />
Table 18: Area estimates <strong>of</strong> <strong>wetl<strong>and</strong></strong>s in Dhemaji<br />
Table 19: Area estimates <strong>of</strong> <strong>wetl<strong>and</strong></strong>s in Tinsukia<br />
Table 20: Area estimates <strong>of</strong> <strong>wetl<strong>and</strong></strong>s in Dibrugarh<br />
Table 21: Area estimates <strong>of</strong> <strong>wetl<strong>and</strong></strong>s in Sibsagar<br />
Table 22: Area estimates <strong>of</strong> <strong>wetl<strong>and</strong></strong>s in Jorhat<br />
Table 23: Area estimates <strong>of</strong> <strong>wetl<strong>and</strong></strong>s in Golaghat<br />
Table 24: Area estimates <strong>of</strong> <strong>wetl<strong>and</strong></strong>s in Karbi Anglong<br />
Table 25: Area estimates <strong>of</strong> <strong>wetl<strong>and</strong></strong>s in North Cachar Hills<br />
Table 26: Area estimates <strong>of</strong> <strong>wetl<strong>and</strong></strong>s in Cachar<br />
Table 27: Area estimates <strong>of</strong> <strong>wetl<strong>and</strong></strong>s in Karimganj<br />
Table 28: Area estimates <strong>of</strong> <strong>wetl<strong>and</strong></strong>s in Hailak<strong>and</strong>i<br />
List <strong>of</strong> Plates<br />
Plate 1: Major <strong>wetl<strong>and</strong></strong> types <strong>of</strong> Assam<br />
Plate 2a <strong>and</strong> 2b: Field photographs <strong>and</strong> ground truth data <strong>of</strong> different <strong>wetl<strong>and</strong></strong> types in Assam<br />
Plate 3: Field observation on the status <strong>of</strong> hydrophytes (free floating mat type emergent anchored <strong>and</strong> swamp type)<br />
Plate 4: Deepor Beel<br />
Plate 5: Wetl<strong>and</strong> map - 5 km buffer area <strong>of</strong> Deepor Beel<br />
Plate 6: IRS LISS-III FCC - 5 km buffer area <strong>of</strong> Deepor Beel<br />
Plate 7: Dhir Beel<br />
Plate 8: Wetl<strong>and</strong> map - 5 km buffer area <strong>of</strong> Dhir Beel<br />
Plate 9: IRS LISS-III FCC - 5 km buffer area <strong>of</strong> Dhir Beel<br />
Plate 10: Sareswar Beel<br />
Plate 11: Wetl<strong>and</strong> map - 5 km buffer area <strong>of</strong> Sareswar Beel<br />
Plate 12: IRS LISS-III FCC - 5 km buffer area <strong>of</strong> Sareswar Beel<br />
Plate 13: Sone Lake<br />
Plate 14: Wetl<strong>and</strong> map - 5 km buffer area <strong>of</strong> Sone Lake<br />
Plate 15: IRS LISS-III FCC - 5 km buffer area <strong>of</strong> Sone Lake<br />
Plate 16: Tamaranga Beel<br />
Plate 17: Wetl<strong>and</strong> map - 5 km buffer area <strong>of</strong> Tamaranga Beel<br />
Plate 18: IRS LISS-III FCC - 5 km buffer area <strong>of</strong> Tamaranga Beel<br />
Plate 19: Sonai Beel (N<strong>and</strong>ini/Mer/Sonai/Raumari/Dobarani/Patiab<strong>and</strong>ha beel)<br />
Plate 20: Wetl<strong>and</strong> map - 5 km buffer area <strong>of</strong> Sonai Beel<br />
Plate 21: IRS LISS-III FCC - 5 km buffer area <strong>of</strong> Sonai Beel