BPZ Resources, Inc. - Shareholder.com
BPZ Resources, Inc. - Shareholder.com
BPZ Resources, Inc. - Shareholder.com

Create successful ePaper yourself
Turn your PDF publications into a flip-book with our unique Google optimized e-Paper software.
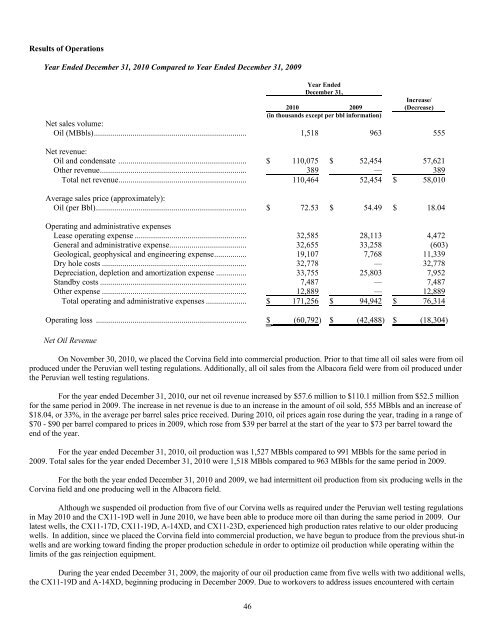
Results of Operations<br />
Year Ended December 31, 2010 Compared to Year Ended December 31, 2009<br />
46<br />
Year Ended<br />
December 31,<br />
2010 2009<br />
(in thousands except per bbl information)<br />
<strong>Inc</strong>rease/<br />
(Decrease)<br />
Net sales volume:<br />
Oil (MBbls)........................................................................... 1,518 963 555<br />
Net revenue:<br />
Oil and condensate ............................................................... $ 110,075 $ 52,454 57,621<br />
Other revenue........................................................................ 389 — 389<br />
Total net revenue............................................................... 110,464 52,454 $ 58,010<br />
Average sales price (approximately):<br />
Oil (per Bbl).......................................................................... $ 72.53 $ 54.49 $ 18.04<br />
Operating and administrative expenses<br />
Lease operating expense ....................................................... 32,585 28,113 4,472<br />
General and administrative expense...................................... 32,655 33,258 (603)<br />
Geological, geophysical and engineering expense................ 19,107 7,768 11,339<br />
Dry hole costs ....................................................................... 32,778 — 32,778<br />
Depreciation, depletion and amortization expense ............... 33,755 25,803 7,952<br />
Standby costs ........................................................................ 7,487 — 7,487<br />
Other expense ....................................................................... 12,889 — 12,889<br />
Total operating and administrative expenses .................... $ 171,256 $ 94,942 $ 76,314<br />
Operating loss .......................................................................... $ (60,792) $ (42,488) $ (18,304)<br />
Net Oil Revenue<br />
On November 30, 2010, we placed the Corvina field into <strong>com</strong>mercial production. Prior to that time all oil sales were from oil<br />
produced under the Peruvian well testing regulations. Additionally, all oil sales from the Albacora field were from oil produced under<br />
the Peruvian well testing regulations.<br />
For the year ended December 31, 2010, our net oil revenue increased by $57.6 million to $110.1 million from $52.5 million<br />
for the same period in 2009. The increase in net revenue is due to an increase in the amount of oil sold, 555 MBbls and an increase of<br />
$18.04, or 33%, in the average per barrel sales price received. During 2010, oil prices again rose during the year, trading in a range of<br />
$70 - $90 per barrel <strong>com</strong>pared to prices in 2009, which rose from $39 per barrel at the start of the year to $73 per barrel toward the<br />
end of the year.<br />
For the year ended December 31, 2010, oil production was 1,527 MBbls <strong>com</strong>pared to 991 MBbls for the same period in<br />
2009. Total sales for the year ended December 31, 2010 were 1,518 MBbls <strong>com</strong>pared to 963 MBbls for the same period in 2009.<br />
For the both the year ended December 31, 2010 and 2009, we had intermittent oil production from six producing wells in the<br />
Corvina field and one producing well in the Albacora field.<br />
Although we suspended oil production from five of our Corvina wells as required under the Peruvian well testing regulations<br />
in May 2010 and the CX11-19D well in June 2010, we have been able to produce more oil than during the same period in 2009. Our<br />
latest wells, the CX11-17D, CX11-19D, A-14XD, and CX11-23D, experienced high production rates relative to our older producing<br />
wells. In addition, since we placed the Corvina field into <strong>com</strong>mercial production, we have begun to produce from the previous shut-in<br />
wells and are working toward finding the proper production schedule in order to optimize oil production while operating within the<br />
limits of the gas reinjection equipment.<br />
During the year ended December 31, 2009, the majority of our oil production came from five wells with two additional wells,<br />
the CX11-19D and A-14XD, beginning producing in December 2009. Due to workovers to address issues encountered with certain