Read the DyStar Sustainability Report 2011...
Read the DyStar Sustainability Report 2011...
Read the DyStar Sustainability Report 2011...

Create successful ePaper yourself
Turn your PDF publications into a flip-book with our unique Google optimized e-Paper software.
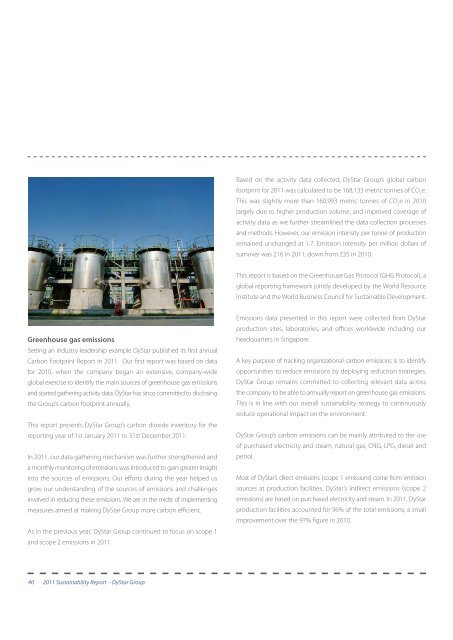
Greenhouse gas emissions<br />
Setting an industry leadership example <strong>DyStar</strong> published its first annual<br />
Carbon Footprint <strong>Report</strong> in <strong>2011.</strong> Our first report was based on data<br />
for 2010, when <strong>the</strong> company began an extensive, company-wide<br />
global exercise to identify <strong>the</strong> main sources of greenhouse gas emissions<br />
and started ga<strong>the</strong>ring activity data. <strong>DyStar</strong> has since committed to disclosing<br />
<strong>the</strong> Group’s carbon footprint annually.<br />
This report presents <strong>DyStar</strong> Group’s carbon dioxide inventory for <strong>the</strong><br />
reporting year of 1st January 2011 to 31st December <strong>2011.</strong><br />
In 2011, our data ga<strong>the</strong>ring mechanism was fur<strong>the</strong>r streng<strong>the</strong>ned and<br />
a monthly monitoring of emissions was introduced to gain greater insight<br />
into <strong>the</strong> sources of emissions. Our efforts during <strong>the</strong> year helped us<br />
grow our understanding of <strong>the</strong> sources of emissions and challenges<br />
involved in reducing <strong>the</strong>se emissions. We are in <strong>the</strong> midst of implementing<br />
measures aimed at making <strong>DyStar</strong> Group more carbon efficient.<br />
As in <strong>the</strong> previous year, <strong>DyStar</strong> Group continued to focus on scope 1<br />
and scope 2 emissions in <strong>2011.</strong><br />
40 2011 <strong>Sustainability</strong> <strong>Report</strong> - <strong>DyStar</strong> Group<br />
Based on <strong>the</strong> activity data collected, <strong>DyStar</strong> Group’s global carbon<br />
footprint for 2011 was calculated to be 168,133 metric tonnes of CO e. 2<br />
This was slightly more than 160,993 metric tonnes of CO e in 2010<br />
2<br />
largely due to higher production volume, and improved coverage of<br />
activity data as we fur<strong>the</strong>r streamlined <strong>the</strong> data collection processes<br />
and methods. However, our emission intensity per tonne of production<br />
remained unchanged at 1.7. Emission intensity per million dollars of<br />
turnover was 216 in 2011, down from 235 in 2010.<br />
This report is based on <strong>the</strong> Greenhouse Gas Protocol (GHG Protocol), a<br />
global reporting framework jointly developed by <strong>the</strong> World Resource<br />
Institute and <strong>the</strong> World Business Council for Sustainable Development.<br />
Emissions data presented in this report were collected from <strong>DyStar</strong><br />
production sites, laboratories, and offices worldwide including our<br />
headquarters in Singapore.<br />
A key purpose of tracking organizational carbon emissions is to identify<br />
opportunities to reduce emissions by deploying reduction strategies.<br />
<strong>DyStar</strong> Group remains committed to collecting relevant data across<br />
<strong>the</strong> company to be able to annually report on greenhouse gas emissions.<br />
This is in line with our overall sustainability strategy to continuously<br />
reduce operational impact on <strong>the</strong> environment.<br />
<strong>DyStar</strong> Group’s carbon emissions can be mainly attributed to <strong>the</strong> use<br />
of purchased electricity and steam, natural gas, CNG, LPG, diesel and<br />
petrol.<br />
Most of <strong>DyStar</strong>’s direct emissions (scope 1 emissions) come from emission<br />
sources at production facilities. <strong>DyStar</strong>’s indirect emissions (scope 2<br />
emissions) are based on purchased electricity and steam. In 2011, <strong>DyStar</strong><br />
production facilities accounted for 96% of <strong>the</strong> total emissions, a small<br />
improvement over <strong>the</strong> 97% figure in 2010.