Doing the Math - JHU Mathematics - Johns Hopkins University
Doing the Math - JHU Mathematics - Johns Hopkins University
Doing the Math - JHU Mathematics - Johns Hopkins University
You also want an ePaper? Increase the reach of your titles
YUMPU automatically turns print PDFs into web optimized ePapers that Google loves.
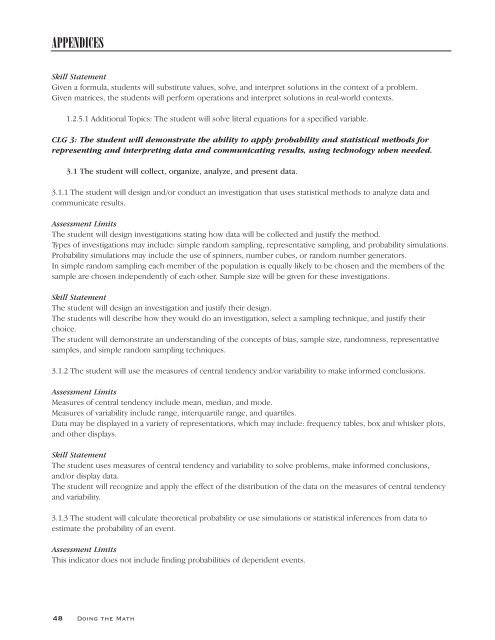
APPENDICES<br />
Skill Statement<br />
Given a formula, students will substitute values, solve, and interpret solutions in <strong>the</strong> context of a problem.<br />
Given matrices, <strong>the</strong> students will perform operations and interpret solutions in real-world contexts.<br />
1.2.5.1 Additional Topics: The student will solve literal equations for a specified variable.<br />
CLG 3: The student will demonstrate <strong>the</strong> ability to apply probability and statistical methods for<br />
representing and interpreting data and communicating results, using technology when needed.<br />
3.1 The student will collect, organize, analyze, and present data.<br />
3.1.1 The student will design and/or conduct an investigation that uses statistical methods to analyze data and<br />
communicate results.<br />
Assessment Limits<br />
The student will design investigations stating how data will be collected and justify <strong>the</strong> method.<br />
Types of investigations may include: simple random sampling, representative sampling, and probability simulations.<br />
Probability simulations may include <strong>the</strong> use of spinners, number cubes, or random number generators.<br />
In simple random sampling each member of <strong>the</strong> population is equally likely to be chosen and <strong>the</strong> members of <strong>the</strong><br />
sample are chosen independently of each o<strong>the</strong>r. Sample size will be given for <strong>the</strong>se investigations.<br />
Skill Statement<br />
The student will design an investigation and justify <strong>the</strong>ir design.<br />
The students will describe how <strong>the</strong>y would do an investigation, select a sampling technique, and justify <strong>the</strong>ir<br />
choice.<br />
The student will demonstrate an understanding of <strong>the</strong> concepts of bias, sample size, randomness, representative<br />
samples, and simple random sampling techniques.<br />
3.1.2 The student will use <strong>the</strong> measures of central tendency and/or variability to make informed conclusions.<br />
Assessment Limits<br />
Measures of central tendency include mean, median, and mode.<br />
Measures of variability include range, interquartile range, and quartiles.<br />
Data may be displayed in a variety of representations, which may include: frequency tables, box and whisker plots,<br />
and o<strong>the</strong>r displays.<br />
Skill Statement<br />
The student uses measures of central tendency and variability to solve problems, make informed conclusions,<br />
and/or display data.<br />
The student will recognize and apply <strong>the</strong> effect of <strong>the</strong> distribution of <strong>the</strong> data on <strong>the</strong> measures of central tendency<br />
and variability.<br />
3.1.3 The student will calculate <strong>the</strong>oretical probability or use simulations or statistical inferences from data to<br />
estimate <strong>the</strong> probability of an event.<br />
Assessment Limits<br />
This indicator does not include finding probabilities of dependent events.<br />
48 <strong>Doing</strong> <strong>the</strong> <strong>Math</strong>


