Doing the Math - JHU Mathematics - Johns Hopkins University
Doing the Math - JHU Mathematics - Johns Hopkins University
Doing the Math - JHU Mathematics - Johns Hopkins University
You also want an ePaper? Increase the reach of your titles
YUMPU automatically turns print PDFs into web optimized ePapers that Google loves.
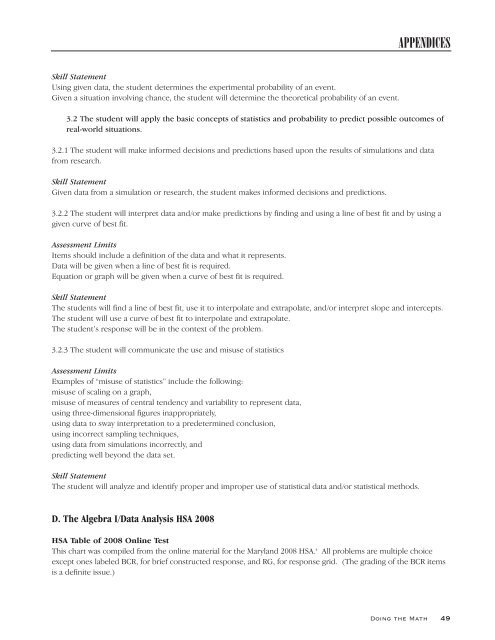
Skill Statement<br />
Using given data, <strong>the</strong> student determines <strong>the</strong> experimental probability of an event.<br />
Given a situation involving chance, <strong>the</strong> student will determine <strong>the</strong> <strong>the</strong>oretical probability of an event.<br />
APPENDICES<br />
3.2 The student will apply <strong>the</strong> basic concepts of statistics and probability to predict possible outcomes of<br />
real-world situations.<br />
3.2.1 The student will make informed decisions and predictions based upon <strong>the</strong> results of simulations and data<br />
from research.<br />
Skill Statement<br />
Given data from a simulation or research, <strong>the</strong> student makes informed decisions and predictions.<br />
3.2.2 The student will interpret data and/or make predictions by finding and using a line of best fit and by using a<br />
given curve of best fit.<br />
Assessment Limits<br />
Items should include a definition of <strong>the</strong> data and what it represents.<br />
Data will be given when a line of best fit is required.<br />
Equation or graph will be given when a curve of best fit is required.<br />
Skill Statement<br />
The students will find a line of best fit, use it to interpolate and extrapolate, and/or interpret slope and intercepts.<br />
The student will use a curve of best fit to interpolate and extrapolate.<br />
The student’s response will be in <strong>the</strong> context of <strong>the</strong> problem.<br />
3.2.3 The student will communicate <strong>the</strong> use and misuse of statistics<br />
Assessment Limits<br />
Examples of “misuse of statistics” include <strong>the</strong> following:<br />
misuse of scaling on a graph,<br />
misuse of measures of central tendency and variability to represent data,<br />
using three-dimensional figures inappropriately,<br />
using data to sway interpretation to a predetermined conclusion,<br />
using incorrect sampling techniques,<br />
using data from simulations incorrectly, and<br />
predicting well beyond <strong>the</strong> data set.<br />
Skill Statement<br />
The student will analyze and identify proper and improper use of statistical data and/or statistical methods.<br />
D. The Algebra I/Data Analysis HSA 2008<br />
HSA Table of 2008 Online Test<br />
This chart was compiled from <strong>the</strong> online material for <strong>the</strong> Maryland 2008 HSA. 4 All problems are multiple choice<br />
except ones labeled BCR, for brief constructed response, and RG, for response grid. (The grading of <strong>the</strong> BCR items<br />
is a definite issue.)<br />
<strong>Doing</strong> <strong>the</strong> <strong>Math</strong> 49


