download - UvA DARE
download - UvA DARE
download - UvA DARE

Create successful ePaper yourself
Turn your PDF publications into a flip-book with our unique Google optimized e-Paper software.
also adapted to public opinion, I have compared the distribution of a party’s MPs<br />
over the Left-Right scale with the distribution of that party’s voters. For smaller<br />
parties with only a handful of MPs, one can hardly speak of a ‘distribution’, and<br />
comparison with the voters’ distribution does not make much sense. For that reason,<br />
the analysis is confined to parties with relatively sizeable parliamentary party<br />
groups at all five points in time. These are the three established parties: Labour<br />
(PvdA), the Christian Democrats (CDA), and the Conservative Liberals (VVD).<br />
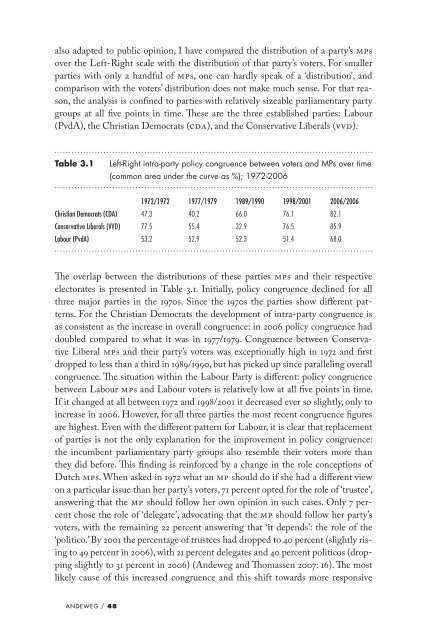
Table 3.1 Left-Right intra-party policy congruence between voters and MPs over time<br />
(common area under the curve as %); 1972-2006<br />
1972/1972 1977/1979 1989/1990 1998/2001 2006/2006<br />
Christian Democrats (CDA) 47.3 40.2 66.0 76.1 82.1<br />
Conservative Liberals (VVD) 77.5 55.4 32.9 76.5 85.9<br />
Labour (PvdA) 53.2 52.9 52.3 51.4 68.0<br />
The overlap between the distributions of these parties MPs and their respective<br />
electorates is presented in Table 3.1. Initially, policy congruence declined for all<br />
three major parties in the 1970s. Since the 1970s the parties show different patterns.<br />
For the Christian Democrats the development of intra-party congruence is<br />
as consistent as the increase in overall congruence: in 2006 policy congruence had<br />
doubled compared to what it was in 1977/1979. Congruence between Conservative<br />
Liberal MPs and their party’s voters was exceptionally high in 1972 and first<br />
dropped to less than a third in 1989/1990, but has picked up since paralleling overall<br />
congruence. The situation within the Labour Party is different: policy congruence<br />
between Labour MPs and Labour voters is relatively low at all five points in time.<br />
If it changed at all between 1972 and 1998/2001 it decreased ever so slightly, only to<br />
increase in 2006. However, for all three parties the most recent congruence figures<br />
are highest. Even with the different pattern for Labour, it is clear that replacement<br />
of parties is not the only explanation for the improvement in policy congruence:<br />
the incumbent parliamentary party groups also resemble their voters more than<br />
they did before. This finding is reinforced by a change in the role conceptions of<br />
Dutch MPs. When asked in 1972 what an MP should do if she had a different view<br />
on a particular issue than her party’s voters, 71 percent opted for the role of ‘trustee’,<br />
answering that the MP should follow her own opinion in such cases. Only 7 percent<br />
chose the role of ‘delegate’, advocating that the MP should follow her party’s<br />
voters, with the remaining 22 percent answering that ‘it depends’: the role of the<br />
‘politico.’ By 2001 the percentage of trustees had dropped to 40 percent (slightly rising<br />
to 49 percent in 2006), with 21 percent delegates and 40 percent politicos (dropping<br />
slightly to 31 percent in 2006) (Andeweg and Thomassen 2007: 16). The most<br />
likely cause of this increased congruence and this shift towards more responsive<br />
AndeWeg / 48