Activities (1,3 MB) - Colruyt Group
Activities (1,3 MB) - Colruyt Group
Activities (1,3 MB) - Colruyt Group

Create successful ePaper yourself
Turn your PDF publications into a flip-book with our unique Google optimized e-Paper software.
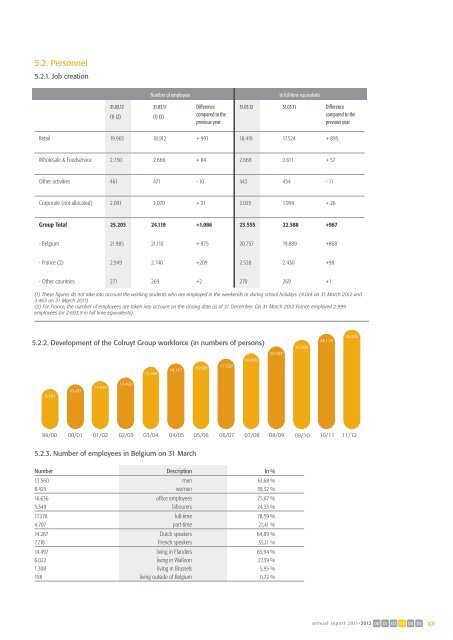
5.2. Personnel<br />
5.2.1. Job creation<br />
31.03.12<br />
(1) (2)<br />
5.2.3. Number of employees in Belgium on 31 March<br />
Number of employees In full-time equivalents<br />
31.03.11<br />
(1) (2)<br />
Difference<br />
compared to the<br />
previous year<br />
31.03.12 31.03.11 Difference<br />
compared to the<br />
previous year<br />
Retail 19.903 18.912 + 991 18.419 17.524 + 895<br />
Wholesale & Foodservice 2.750 2.666 + 84 2.668 2.611 + 57<br />
Other activities 461 471 - 10 443 454 - 11<br />
Corporate (not allocated) 2.091 2.070 + 21 2.025 1.999 + 26<br />
<strong>Group</strong> Total<br />
- Belgium<br />
- France (2)<br />
- Other countries<br />
25.205<br />
21.985<br />
2.949<br />
271<br />
24.119<br />
21.110<br />
2.740<br />
269<br />
+1.086<br />
+ 875<br />
+209<br />
+2<br />
(1) These figures do not take into account the working students who are employed in the weekends or during school holidays. (4.014 on 31 March 2012 and<br />
3.463 on 31 March 2011)<br />
(2) For France, the number of employees are taken into account on the closing date as of 31 December. On 31 March 2012 France employed 2.999<br />
employees (or 2.693,9 in full time equivalents).<br />
Evolutie personeelbestand Groep<br />
23.555<br />
20.757<br />
5.2.2. Development of the <strong>Colruyt</strong> <strong>Group</strong> workforce (in numbers of persons)<br />
9.283<br />
10.497<br />
11.410<br />
12.402<br />
15.185<br />
16.157<br />
16.599<br />
Number Description In %<br />
13.560 men 61,68 %<br />
8.425 women 38,32 %<br />
16.636 office employees 75,67 %<br />
5.349 labourers 24,33 %<br />
17.278 full-time 78,59 %<br />
4.707 part-time 21,41 %<br />
14.267 Dutch speakers 64,89 %<br />
7.718 French speakers 35,11 %<br />
14.497 living in Flanders 65,94 %<br />
6.022 living in Walloon 27,39 %<br />
1.308 living in Brussels 5,95 %<br />
158 living outside of Belgium 0,72 %<br />
2.528<br />
270<br />
22.588<br />
99/00 00/01 01/02 02/03 03/04 04/05 05/06 06/07 07/08 08/09 09/10 10/11 11/12<br />
17.329<br />
18.870<br />
20.762<br />
19.889<br />
2.430<br />
269<br />
22.566<br />
+967<br />
+868<br />
+98<br />
+1<br />
24.119<br />
25.205<br />
annual report 2011•2012 00 01 02 03 04 05<br />
101