FINAL CLUSTER ANALYSIS - Kohtla-Järve
FINAL CLUSTER ANALYSIS - Kohtla-Järve
FINAL CLUSTER ANALYSIS - Kohtla-Järve

You also want an ePaper? Increase the reach of your titles
YUMPU automatically turns print PDFs into web optimized ePapers that Google loves.
Final Cluster Analysis<br />
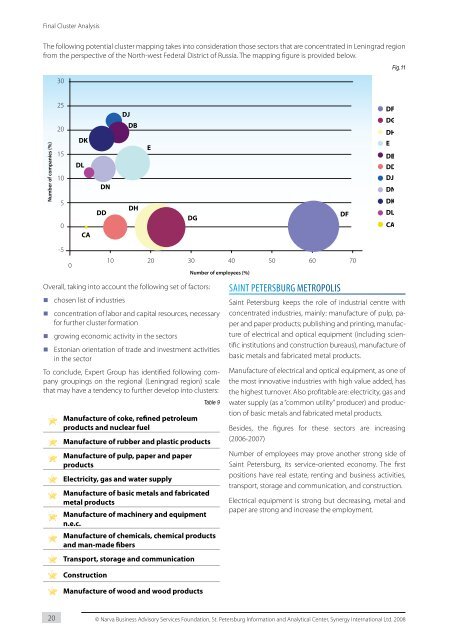
The following potential cluster mapping takes into consideration those sectors that are concentrated in Leningrad region<br />
from the perspective of the North-west Federal District of Russia. The mapping figure is provided below.<br />
Number of companies (%)<br />
30<br />
25<br />
20<br />
15<br />
10<br />
5<br />
0<br />
-5<br />
0<br />
DK<br />
DL<br />
CA<br />
DN<br />
DD<br />
DJ<br />
DB<br />
DH<br />
E<br />
DG<br />
10 20 30 40 50 60 70<br />
Overall, taking into account the following set of factors:<br />
chosen list of industries<br />
concentration of labor and capital resources, necessary<br />
for further cluster formation<br />
growing economic activity in the sectors<br />
Estonian orientation of trade and investment activities<br />
in the sector<br />
To conclude, Expert Group has identified following company<br />
groupings on the regional (Leningrad region) scale<br />
that may have a tendency to further develop into clusters:<br />
20<br />
Manufacture of coke, refined petroleum<br />
products and nuclear fuel<br />
Manufacture of rubber and plastic products<br />
Manufacture of pulp, paper and paper<br />
products<br />
Electricity, gas and water supply<br />
Manufacture of basic metals and fabricated<br />
metal products<br />
Manufacture of machinery and equipment<br />
n.e.c.<br />
Table 9<br />
Manufacture of chemicals, chemical products<br />
and man-made fibers<br />
Transport, storage and communication<br />
Construction<br />
Manufacture of wood and wood products<br />
Number of employees (%)<br />
saInt PetersBurg metroPolIs<br />
DF<br />
DF<br />
DG<br />
DH<br />
E<br />
DB<br />
DD<br />
DJ<br />
DN<br />
DK<br />
DL<br />
CA<br />
Fig.11<br />
Saint Petersburg keeps the role of industrial centre with<br />
concentrated industries, mainly: manufacture of pulp, paper<br />
and paper products; publishing and printing, manufacture<br />
of electrical and optical equipment (including scientific<br />
institutions and construction bureaus), manufacture of<br />
basic metals and fabricated metal products.<br />
Manufacture of electrical and optical equipment, as one of<br />
the most innovative industries with high value added, has<br />
the highest turnover. Also profitable are: electricity, gas and<br />
water supply (as a “common utility” producer) and production<br />
of basic metals and fabricated metal products.<br />
Besides, the figures for these sectors are increasing<br />
(2006-2007)<br />
Number of employees may prove another strong side of<br />
Saint Petersburg, its service-oriented economy. The first<br />
positions have real estate, renting and business activities,<br />
transport, storage and communication, and construction.<br />
Electrical equipment is strong but decreasing, metal and<br />
paper are strong and increase the employment.<br />
© Narva Business Advisory Services Foundation, St. Petersburg Information and Analytical Center, Synergy International Ltd. 2008