

Empirical life cycle models of labour supply and - Statistisk sentralbyrå
Empirical life cycle models of labour supply and - Statistisk sentralbyrå
Empirical life cycle models of labour supply and - Statistisk sentralbyrå

Create successful ePaper yourself
Turn your PDF publications into a flip-book with our unique Google optimized e-Paper software.
Social <strong>and</strong> Economic Studies 91 <strong>Empirical</strong> Life Cycle Models<br />
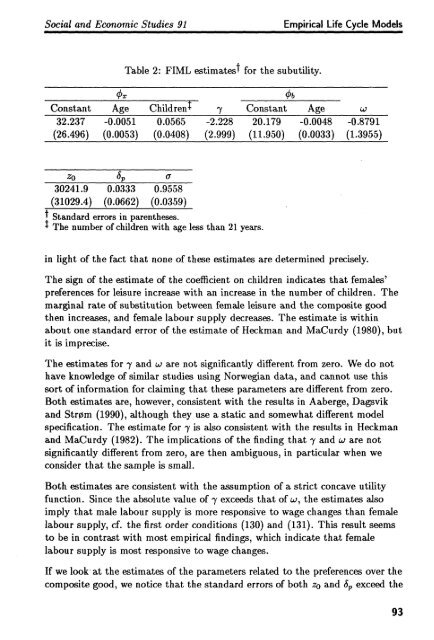
Table 2: FIML estimatest for the subutility.<br />
Constant Age Children 7 Constant Age<br />
32.237 -0.0051 0.0565 -2.228 20.179 -0.0048 -0.8791<br />
(26.496) (0.0053) (0.0408) (2.999) (11.950) (0.0033) (1.3955)<br />
zoS o-<br />
30241.9 0.0333 0.9558<br />
(31029.4) (0.0662) (0.0359)<br />
t St<strong>and</strong>ard errors in parentheses.<br />
t The number <strong>of</strong> children with age less than 21 years.<br />
in light <strong>of</strong> the fact that none <strong>of</strong> these estimates are determined precisely.<br />
The sign <strong>of</strong> the estimate <strong>of</strong> the coefficient on children indicates that females'<br />
preferences for leisure increase with an increase in the number <strong>of</strong> children. The<br />
marginal rate <strong>of</strong> substitution between female leisure <strong>and</strong> the composite good<br />
then increases, <strong>and</strong> female <strong>labour</strong> <strong>supply</strong> decreases. The estimate is within<br />
about one st<strong>and</strong>ard error <strong>of</strong> the estimate <strong>of</strong> Heckman <strong>and</strong> MaCurdy (1980), but<br />
it is imprecise.<br />
The estimates for 7 <strong>and</strong> co are not significantly different from zero. We do not<br />
have knowledge <strong>of</strong> similar studies using Norwegian data, <strong>and</strong> cannot use this<br />
sort <strong>of</strong> information for claiming that these parameters are different from zero.<br />
Both estimates are, however, consistent with the results in Aaberge, Dagsvik<br />
<strong>and</strong> Strom (1990), although they use a static <strong>and</strong> somewhat different model<br />
specification. The estimate for -y is also consistent with the results in Heckman<br />
<strong>and</strong> MaCurdy (1982). The implications <strong>of</strong> the finding that 7 <strong>and</strong> ca are not<br />
significantly different from zero, are then ambiguous, in particular when we<br />
consider that the sample is small.<br />
Both estimates are consistent with the assumption <strong>of</strong> a strict concave utility<br />
function. Since the absolute value <strong>of</strong> 7 exceeds that <strong>of</strong> w, the estimates also<br />
imply that male <strong>labour</strong> <strong>supply</strong> is more responsive to wage changes than female<br />
<strong>labour</strong> <strong>supply</strong>, cf. the first order conditions (130) <strong>and</strong> (131). This result seems<br />
to be in contrast with most empirical findings, which indicate that female<br />
<strong>labour</strong> <strong>supply</strong> is most responsive to wage changes.<br />
If we look at the estimates <strong>of</strong> the parameters related to the preferences over the<br />
composite good, we notice that the st<strong>and</strong>ard errors <strong>of</strong> both zo <strong>and</strong> st, exceed the<br />
93


