International Journal of Noni Research - Noni Family
International Journal of Noni Research - Noni Family
International Journal of Noni Research - Noni Family

Create successful ePaper yourself
Turn your PDF publications into a flip-book with our unique Google optimized e-Paper software.
55 Intl. J. <strong>Noni</strong> Res. 2007, 2(1-2)<br />
D.R. Singh et al. Morinda citrifolia L. – An evergreen plant for diversification in commercial horticulture<br />
<strong>of</strong> 4.62, 4.50 and 4.39 ppm in 75%, 50% and 100% sea water irrigation<br />
treatments, respectively.<br />
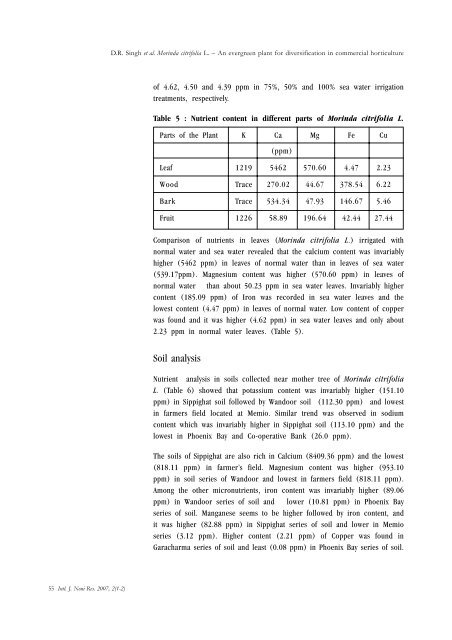
Table 5 : Nutrient content in different parts <strong>of</strong> Morinda citrifolia L.<br />
Parts <strong>of</strong> the Plant K Ca Mg Fe Cu<br />
(ppm)<br />
Leaf 1219 5462 570.60 4.47 2.23<br />
Wood Trace 270.02 44.67 378.54 6.22<br />
Bark Trace 534.34 47.93 146.67 5.46<br />
Fruit 1226 58.89 196.64 42.44 27.44<br />
Comparison <strong>of</strong> nutrients in leaves (Morinda citrifolia L.) irrigated with<br />
normal water and sea water revealed that the calcium content was invariably<br />
higher (5462 ppm) in leaves <strong>of</strong> normal water than in leaves <strong>of</strong> sea water<br />
(539.17ppm). Magnesium content was higher (570.60 ppm) in leaves <strong>of</strong><br />
normal water than about 50.23 ppm in sea water leaves. Invariably higher<br />
content (185.09 ppm) <strong>of</strong> Iron was recorded in sea water leaves and the<br />
lowest content (4.47 ppm) in leaves <strong>of</strong> normal water. Low content <strong>of</strong> copper<br />
was found and it was higher (4.62 ppm) in sea water leaves and only about<br />
2.23 ppm in normal water leaves. (Table 5).<br />
Soil analysis<br />
Nutrient analysis in soils collected near mother tree <strong>of</strong> Morinda citrifolia<br />
L. (Table 6) showed that potassium content was invariably higher (151.10<br />
ppm) in Sippighat soil followed by Wandoor soil (112.30 ppm) and lowest<br />
in farmers field located at Memio. Similar trend was observed in sodium<br />
content which was invariably higher in Sippighat soil (113.10 ppm) and the<br />
lowest in Phoenix Bay and Co-operative Bank (26.0 ppm).<br />
The soils <strong>of</strong> Sippighat are also rich in Calcium (8409.36 ppm) and the lowest<br />
(818.11 ppm) in farmer’s field. Magnesium content was higher (953.10<br />
ppm) in soil series <strong>of</strong> Wandoor and lowest in farmers field (818.11 ppm).<br />
Among the other micronutrients, iron content was invariably higher (89.06<br />
ppm) in Wandoor series <strong>of</strong> soil and lower (10.81 ppm) in Phoenix Bay<br />
series <strong>of</strong> soil. Manganese seems to be higher followed by iron content, and<br />
it was higher (82.88 ppm) in Sippighat series <strong>of</strong> soil and lower in Memio<br />
series (3.12 ppm). Higher content (2.21 ppm) <strong>of</strong> Copper was found in<br />
Garacharma series <strong>of</strong> soil and least (0.08 ppm) in Phoenix Bay series <strong>of</strong> soil.