NSLS Activity Report 2006 - Brookhaven National Laboratory
NSLS Activity Report 2006 - Brookhaven National Laboratory
NSLS Activity Report 2006 - Brookhaven National Laboratory

Create successful ePaper yourself
Turn your PDF publications into a flip-book with our unique Google optimized e-Paper software.
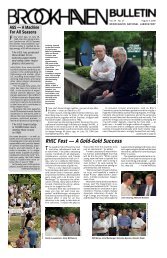
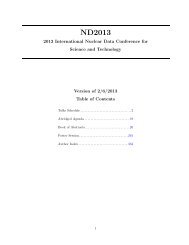
of barium sulfate species formed upon uptake<br />
of SO 2 is different depending on the loading of<br />
barium species – surface or ‘monolayer’ sulfates<br />
for Pt-BaO(8)/Al 2 O 3 , and ‘bulk’ BaSO 4 for the Pt-<br />
BaO(20)/Al 2 O 3 sample. In addition, the amount of<br />
H 2 S produced over Pt-BaO(8)/Al 2 O 3 is two times<br />
larger than that of the sample with higher barium<br />
loadings, which suggests a more facile desulfation<br />
of ‘monolayer’ BaSO 4 .<br />
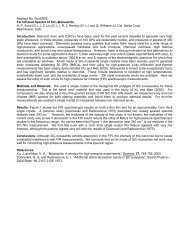
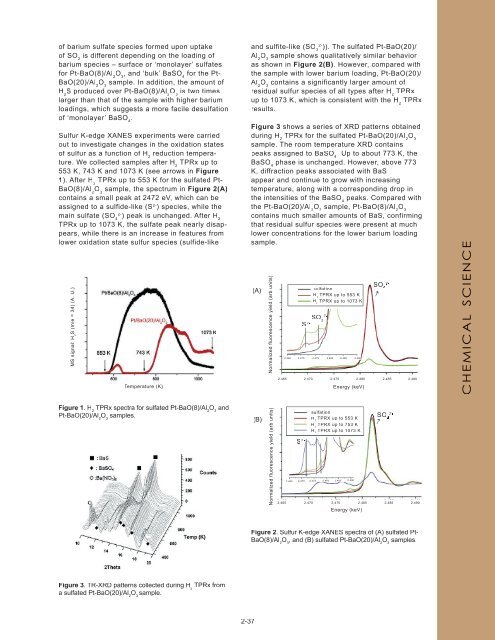
Sulfur K-edge XANES experiments were carried<br />
out to investigate changes in the oxidation states<br />
of sulfur as a function of H reduction tempera-<br />
2<br />
ture. We collected samples after H TPRx up to<br />
2<br />
553 K, 743 K and 1073 K (see arrows in Figure<br />
1). After H TPRx up to 553 K for the sulfated Pt-<br />
2<br />
BaO(8)/Al O sample, the spectrum in Figure 2(A)<br />
2 3<br />
contains a small peak at 2472 eV, which can be<br />
assigned to a sulfide-like (S 2- ) species, while the<br />
2- main sulfate (SO ) peak is unchanged. After H2<br />
4<br />
TPRx up to 1073 K, the sulfate peak nearly disappears,<br />
while there is an increase in features from<br />
lower oxidation state sulfur species (sulfide-like<br />
MS signal: H 2 S (m/e = 34) (A. U.)<br />
Temperature (K)<br />
Figure 1. H 2 TPRx spectra for sulfated Pt-BaO(8)/Al 2 O 3 and<br />
Pt-BaO(20)/Al 2 O 3 samples.<br />
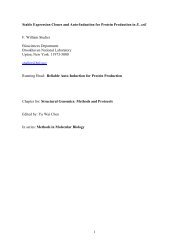
Figure 3. TR-XRD patterns collected during H 2 TPRx from<br />
a sulfated Pt-BaO(20)/Al 2 O 3 sample.<br />
2-37<br />
2- and sulfite-like (SO )). The sulfated Pt-BaO(20)/<br />
3<br />
Al O sample shows qualitatively similar behavior<br />
2 3<br />
as shown in Figure 2(B). However, compared with<br />
the sample with lower barium loading, Pt-BaO(20)/<br />
Al O contains a significantly larger amount of<br />
2 3<br />
residual sulfur species of all types after H TPRx<br />
2<br />
up to 1073 K, which is consistent with the H TPRx<br />
2<br />
results.<br />
Figure 3 shows a series of XRD patterns obtained<br />
during H 2 TPRx for the sulfated Pt-BaO(20)/Al 2 O 3<br />
sample. The room temperature XRD contains<br />
peaks assigned to BaSO 4 . Up to about 773 K, the<br />
BaSO 4 phase is unchanged. However, above 773<br />
K, diffraction peaks associated with BaS<br />
appear and continue to grow with increasing<br />
temperature, along with a corresponding drop in<br />
the intensities of the BaSO 4 peaks. Compared with<br />
the Pt-BaO(20)/Al 2 O 3 sample, Pt-BaO(8)/Al 2 O 3<br />
contains much smaller amounts of BaS, confirming<br />
that residual sulfur species were present at much<br />
lower concentrations for the lower barium loading<br />
sample.<br />
(A)<br />
(B)<br />
Normalized fluorescence yield (arb units)<br />
Normalized fluorescence yield (arb units)<br />
sulfation<br />
H TPRX up to 553 K<br />
2<br />
H TPRX up to 1073 K<br />
2<br />
2- SO3 S2- 2.465 2.470 2.475 2.480 2.485 2.490<br />
2.465 2.470 2.475 2.480 2.485 2.490<br />
S 2-<br />
Energy (keV)<br />
sulfation<br />
H TPRX up to 553 K<br />
2<br />
H TPRX up to 753 K<br />
2<br />
H TPRX up to 1073 K<br />
2<br />
2.465 2.470 2.475 2.480 2.485 2.490<br />
2.465 2.470 2.475 2.480 2.485 2.490<br />
Energy (keV)<br />
2- SO 4<br />
Figure 2. Sulfur K-edge XANES spectra of (A) sulfated Pt-<br />
BaO(8)/Al 2 O 3 , and (B) sulfated Pt-BaO(20)/Al 2 O 3 samples.<br />
↑<br />
↑<br />
2- SO 4<br />
CHEMICAL SCIENCE