NSLS Activity Report 2006 - Brookhaven National Laboratory
NSLS Activity Report 2006 - Brookhaven National Laboratory
NSLS Activity Report 2006 - Brookhaven National Laboratory

You also want an ePaper? Increase the reach of your titles
YUMPU automatically turns print PDFs into web optimized ePapers that Google loves.
ecomes evident through comparison of aliphatic<br />
and aromatic Clorg spectra (Figure 2B, y-z). The<br />
substantial variations in spectral features depending<br />
on the coordination environment of Cl allow<br />
percentage estimates of Clinorg and aliphatic and<br />
aromatic Clorg in natural samples to be ascertained<br />
via least-squares fitting of normalized sample<br />
spectra with spectra of representative model<br />
compounds (Figure 2B). Combination of these<br />
proportions with total Cl concentrations yields the<br />
concentrations of Clinorg, aromatic Clorg, and aliphatic<br />
Clorg in NOM samples.<br />
Total Br concentrations in environmental samples<br />
have been determined via XRF analysis for decades.<br />
The novelty of our application lies in the<br />
Fluorescence yield (FF/I0)<br />
Absolute intensity at 2850.8 eV<br />
Photon Energy (eV)<br />
Chlorine concentration (ppm)<br />
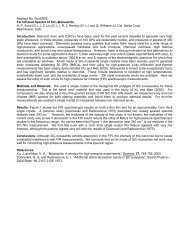
Figure 1. Quantifi cation of Cl concentration from Cl<br />
1s s XANES spectra. (A) Unnormalized Cl 1 s XANES<br />
spectrum of NaCl standard in PAA matrix (200 ppm Cl).<br />
The difference at 2850.8 eV between splines through the<br />
pre-edge and post-edge regions is used as a measure<br />
of absolute Cl fl uorescence intensity. (B) Relationship<br />
between Cl concentration in PAA-based NaCl standards<br />
and absolute Cl fl uorescence intensity. Dashed line,<br />
equation, and R2 value represent linear fi ts to the data.<br />
2-61<br />
combination of quantitative information from XRF<br />
(acquired at beamline X26A) with Br speciation<br />
information from Br 1s XANES spectra (acquired<br />
at beamline X23A2) to determine absolute concentrations<br />
of Brorg and Brinorg in chemically heterogeneous<br />
sediments.<br />
This method provides a rigorous new approach to<br />
the determination of organohalogen concentrations<br />
in complex natural samples in situ. Robust, quantitative<br />
information about organohalogen fluxes in<br />
soil and sediment systems will help complete the<br />
description of natural halogen cycles, potentially<br />
illuminating the sources and sinks of naturally<br />
and industrially produced organohalogens in the<br />
environment.<br />
Fluorescence yield (FF/I0)<br />
Photon Energy (eV)<br />
Photon Energy (eV)<br />
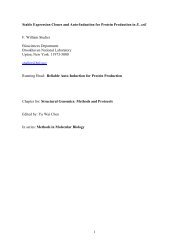
Figure 2. Determination of Cl speciation and concentration<br />
in NOM samples from Cl 1s s XANES spectra. (A)<br />
Unnormalized Cl 1s s XANES spectra of pulverized oak<br />
leaves at different stages of decay (a = least degraded; b =<br />
more degraded; c = most degraded). Arrows illustrate the<br />
differences in absolute Cl fl uorescence intensity among the<br />
spectra. (B) Least-squares fi t of background-subtracted,<br />
normalized spectrum b with representative inorganic (x,<br />
glycine-HCl), aliphatic (y, chlorodecane), and aromatic (z,<br />
chlorophenol red) Cl model compounds. Spectrum b data<br />
are represented by circles and fi t by the solid line; r is the<br />
residual after the fi t. Estimated Cl speciation by leastsquares<br />
fi tting: a, 78% inorganic (284 ppm), 16% aromatic<br />
(58 ppm), 6% aliphatic (22 ppm); b, 40% inorganic (56<br />
ppm), 20% aromatic (29 ppm), 40% aliphatic (56 ppm);<br />
c, 16% inorganic (12 ppm), 42% aromatic (29 ppm), 42%<br />
aliphatic (29 ppm).<br />
GEOLOGY AND ENVIRONMENTAL SCIENCE