NSLS Activity Report 2006 - Brookhaven National Laboratory
NSLS Activity Report 2006 - Brookhaven National Laboratory
NSLS Activity Report 2006 - Brookhaven National Laboratory

You also want an ePaper? Increase the reach of your titles
YUMPU automatically turns print PDFs into web optimized ePapers that Google loves.
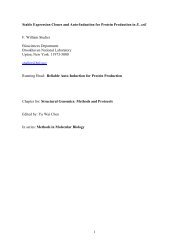
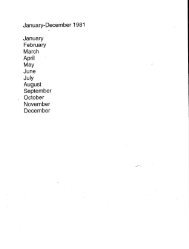
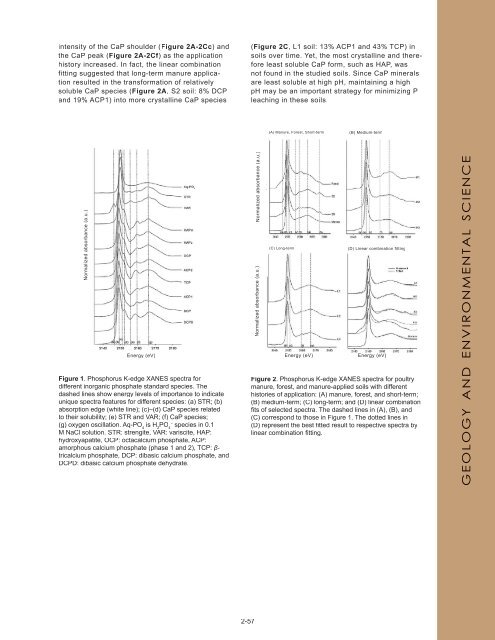
intensity of the CaP shoulder (Figure 2A-2Cc) and<br />
the CaP peak (Figure 2A-2Cf) as the application<br />
history increased. In fact, the linear combination<br />
fitting suggested that long-term manure application<br />
resulted in the transformation of relatively<br />
soluble CaP species (Figure 2A, S2 soil: 8% DCP<br />
and 19% ACP1) into more crystalline CaP species<br />
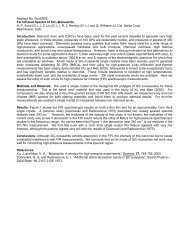
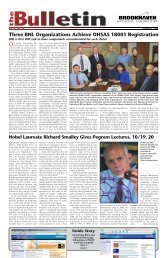
Normalized absorbance (a.u.)<br />
Energy (eV)<br />
Figure 1. Phosphorus K-edge XANES spectra for<br />
different inorganic phosphate standard species. The<br />
dashed lines show energy levels of importance to indicate<br />
unique spectra features for different species: (a) STR; (b)<br />
absorption edge (white line); (c)–(d) CaP species related<br />
to their solubility; (e) STR and VAR; (f) CaP species;<br />
– (g) oxygen oscillation. Aq-PO is H PO species in 0.1<br />
4 2 4<br />
M NaCl solution. STR: strengite, VAR: variscite, HAP:<br />
hydroxyapatite, OCP: octacalcium phosphate, ACP:<br />
amorphous calcium phosphate (phase 1 and 2), TCP: βtricalcium<br />
phosphate, DCP: dibasic calcium phosphate, and<br />
DCPD: dibasic calcium phosphate dehydrate.<br />
2-57<br />
(Figure 2C, L1 soil: 13% ACP1 and 43% TCP) in<br />
soils over time. Yet, the most crystalline and therefore<br />
least soluble CaP form, such as HAP, was<br />
not found in the studied soils. Since CaP minerals<br />
are least soluble at high pH, maintaining a high<br />
pH may be an important strategy for minimizing P<br />
leaching in these soils.<br />
Normalized absorbance (a.u.) Normalized absorbance (a.u.)<br />
(A) Manure, Forest, Short-term (B) Medium-term<br />
(C) Long-term (D) Linear combination fitting<br />
Energy (eV) Energy (eV)<br />
Figure 2. Phosphorus K-edge XANES spectra for poultry<br />
manure, forest, and manure-applied soils with different<br />
histories of application: (A) manure, forest, and short-term;<br />
(B) medium-term; (C) long-term; and (D) linear combination<br />
fi ts of selected spectra. The dashed lines in (A), (B), and<br />
(C) correspond to those in Figure 1. The dotted lines in<br />
(D) represent the best fi tted result to respective spectra by<br />
linear combination fi tting.<br />
GEOLOGY AND ENVIRONMENTAL SCIENCE