NSLS Activity Report 2006 - Brookhaven National Laboratory
NSLS Activity Report 2006 - Brookhaven National Laboratory
NSLS Activity Report 2006 - Brookhaven National Laboratory

You also want an ePaper? Increase the reach of your titles
YUMPU automatically turns print PDFs into web optimized ePapers that Google loves.
energy gap, responsible for suppressing quantum<br />
fluctuations.<br />
What is the source of the energy gap? And here is<br />
a related question: What makes the spins prefer<br />
the a-b plane instead of making a helical structure<br />
in some different planes? The anisotropy in interaction<br />
between the spins is needed to answer both<br />
of these questions. In this case the anisotropy is<br />
of the “easy plane” type: The interaction energies<br />
are larger for spins in the a-b plane than for spins<br />
in other directions. We performed theoretical modeling<br />
and, by fitting the resonance positions for all<br />
field, we determined a single anisotropy parameter<br />
for this system. The model also described the<br />
observed strong field dependence in the intensity<br />
of the resonance.<br />
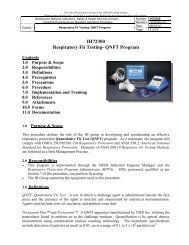
Figure 1. Crystal structure of LiCu 2 O 2 . The magnetic Cu 2+<br />
ions are dark blue, the non-magnetic copper is green, the<br />
lithium is light blue and the oxygen is red. The dark blue<br />
bonds emphasize the triangular spin ladder.<br />
2-43<br />
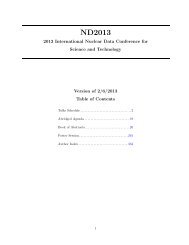
Interestingly, the model predicted two resonances<br />
at finite fields, but the other one (green line in<br />
Figure 3) was much weaker. We suspected that<br />
the instrument we used was not sensitive enough<br />
to see this other line, and we sent the sample<br />
back to EPFL, (Lausanne, Switzerland), where<br />
Bálint Náfrádi did more ESR measurements. The<br />
spectrometer in Lausanne operates at a few fixed<br />
frequencies, and it cannot be used to create a full<br />
two-dimensional map of absorption intensity seen<br />
in Figure 3, but it is much more sensitive than<br />
ours. The resonance line has been found at the<br />
predicted position, and we witnessed one of the<br />
rare cases when the theory not only interpreted<br />
the existing experimental data, but actually predicted<br />
the result of a new experiment.<br />
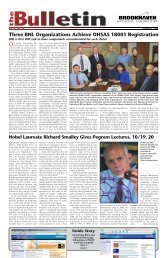
Figure 2. Helical spin order along a triangular ladder in<br />
LiCu 2 O 2 . All spin directions are parallel to the a-b plane,<br />
and subsequent spins on the same leg of the ladder make<br />
an angle slightly larger than 60 o .<br />
Figure 3. Upper panel: Absorption due to spin resonance<br />
as a function of fi eld and frequency. Darker shades indicate<br />
stronger absorption. The red line is a theoretical fi t to the<br />
line position. The green line is another resonance predicted<br />
by the theory. Lower panel: Simulated experimental results,<br />
based on the calculated intensity of the absorption.<br />
CONDENSED MATTER PHYSICS