Investment Plan 2011 - OPERS
Investment Plan 2011 - OPERS
Investment Plan 2011 - OPERS

Create successful ePaper yourself
Turn your PDF publications into a flip-book with our unique Google optimized e-Paper software.
Ohio Public Employees Retirement System<br />
<strong>2011</strong> Annual <strong>Investment</strong> <strong>Plan</strong><br />
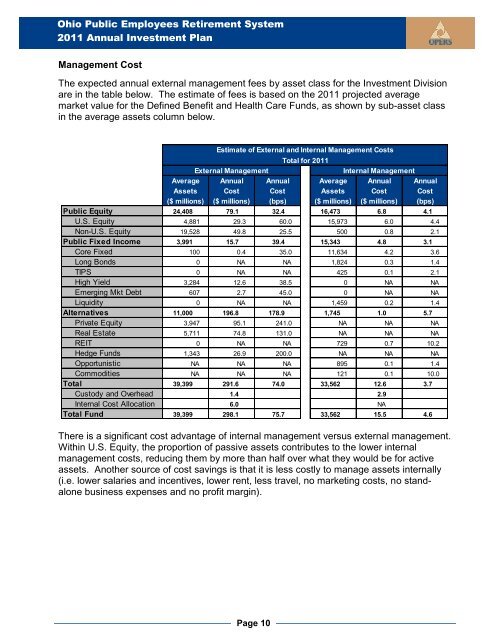
Management Cost<br />
The expected annual external management fees by asset class for the <strong>Investment</strong> Division<br />
are in the table below. The estimate of fees is based on the <strong>2011</strong> projected average<br />
market value for the Defined Benefit and Health Care Funds, as shown by sub-asset class<br />
in the average assets column below.<br />
Estimate of External and Internal Management Costs<br />
Total for <strong>2011</strong><br />
External Management Internal Management<br />
Average Annual Annual Average Annual Annual<br />
Assets Cost Cost Assets Cost Cost<br />
($ millions) ($ millions) (bps) ($ millions) ($ millions) (bps)<br />
Public Equity 24,408 79.1 32.4 16,473 6.8 4.1<br />
U.S. Equity 4,881 29.3 60.0 15,973 6.0 4.4<br />
Non-U.S. Equity 19,528 49.8 25.5 500 0.8 2.1<br />
Public Fixed Income 3,991 15.7 39.4 15,343 4.8 3.1<br />
Core Fixed 100 0.4 35.0 11,634 4.2 3.6<br />
Long Bonds 0 NA NA 1,824 0.3 1.4<br />
TIPS 0 NA NA 425 0.1 2.1<br />
High Yield 3,284 12.6 38.5 0 NA NA<br />
Emerging Mkt Debt 607 2.7 45.0 0 NA NA<br />
Liquidity 0 NA NA 1,459 0.2 1.4<br />
Alternatives 11,000 196.8 178.9 1,745 1.0 5.7<br />
Private Equity 3,947 95.1 241.0 NA NA NA<br />
Real Estate 5,711 74.8 131.0 NA NA NA<br />
REIT 0 NA NA 729 0.7 10.2<br />
Hedge Funds 1,343 26.9 200.0 NA NA NA<br />
Opportunistic NA NA NA 895 0.1 1.4<br />
Commodities NA NA NA 121 0.1 10.0<br />
Total 39,399 291.6 74.0 33,562 12.6 3.7<br />
Custody and Overhead 1.4 2.9<br />
Internal Cost Allocation 6.0 NA<br />
Total Fund 39,399 298.1 75.7 33,562 15.5 4.6<br />
There is a significant cost advantage of internal management versus external management.<br />
Within U.S. Equity, the proportion of passive assets contributes to the lower internal<br />
management costs, reducing them by more than half over what they would be for active<br />
assets. Another source of cost savings is that it is less costly to manage assets internally<br />
(i.e. lower salaries and incentives, lower rent, less travel, no marketing costs, no standalone<br />
business expenses and no profit margin).<br />
Page 10