Investment Plan 2011 - OPERS
Investment Plan 2011 - OPERS
Investment Plan 2011 - OPERS

Create successful ePaper yourself
Turn your PDF publications into a flip-book with our unique Google optimized e-Paper software.
Ohio Public Employees Retirement System<br />
<strong>2011</strong> Annual <strong>Investment</strong> <strong>Plan</strong><br />
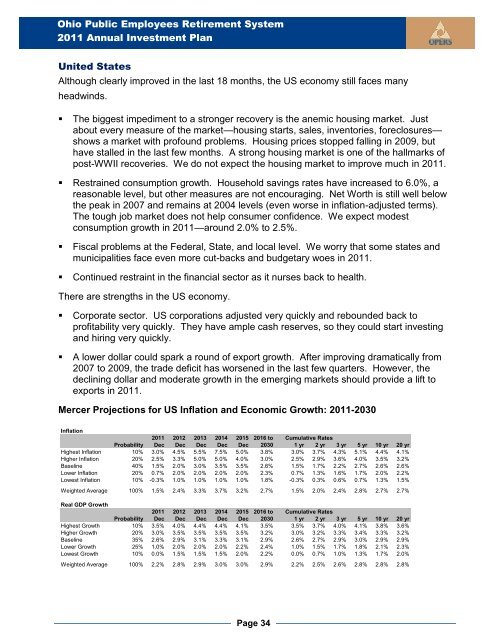
United States<br />
Although clearly improved in the last 18 months, the US economy still faces many<br />
headwinds.<br />
� The biggest impediment to a stronger recovery is the anemic housing market. Just<br />
about every measure of the market—housing starts, sales, inventories, foreclosures—<br />
shows a market with profound problems. Housing prices stopped falling in 2009, but<br />
have stalled in the last few months. A strong housing market is one of the hallmarks of<br />
post-WWII recoveries. We do not expect the housing market to improve much in <strong>2011</strong>.<br />
� Restrained consumption growth. Household savings rates have increased to 6.0%, a<br />
reasonable level, but other measures are not encouraging. Net Worth is still well below<br />
the peak in 2007 and remains at 2004 levels (even worse in inflation-adjusted terms).<br />
The tough job market does not help consumer confidence. We expect modest<br />
consumption growth in <strong>2011</strong>—around 2.0% to 2.5%.<br />
� Fiscal problems at the Federal, State, and local level. We worry that some states and<br />
municipalities face even more cut-backs and budgetary woes in <strong>2011</strong>.<br />
� Continued restraint in the financial sector as it nurses back to health.<br />
There are strengths in the US economy.<br />
� Corporate sector. US corporations adjusted very quickly and rebounded back to<br />
profitability very quickly. They have ample cash reserves, so they could start investing<br />
and hiring very quickly.<br />
� A lower dollar could spark a round of export growth. After improving dramatically from<br />
2007 to 2009, the trade deficit has worsened in the last few quarters. However, the<br />
declining dollar and moderate growth in the emerging markets should provide a lift to<br />
exports in <strong>2011</strong>.<br />
Mercer Projections for US Inflation and Economic Growth: <strong>2011</strong>-2030<br />
Inflation<br />
<strong>2011</strong> 2012 2013 2014 2015 2016 to Cumulative Rates<br />
Probability Dec Dec Dec Dec Dec 2030 1 yr 2 yr 3 yr 5 yr 10 yr 20 yr<br />
Highest Inflation 10% 3.0% 4.5% 5.5% 7.5% 5.0% 3.8% 3.0% 3.7% 4.3% 5.1% 4.4% 4.1%<br />
Higher Inflation 20% 2.5% 3.3% 5.0% 5.0% 4.0% 3.0% 2.5% 2.9% 3.6% 4.0% 3.5% 3.2%<br />
Baseline 40% 1.5% 2.0% 3.0% 3.5% 3.5% 2.6% 1.5% 1.7% 2.2% 2.7% 2.6% 2.6%<br />
Lower Inflation 20% 0.7% 2.0% 2.0% 2.0% 2.0% 2.3% 0.7% 1.3% 1.6% 1.7% 2.0% 2.2%<br />
Lowest Inflation 10% -0.3% 1.0% 1.0% 1.0% 1.0% 1.8% -0.3% 0.3% 0.6% 0.7% 1.3% 1.5%<br />
Weighted Average 100% 1.5% 2.4% 3.3% 3.7% 3.2% 2.7% 1.5% 2.0% 2.4% 2.8% 2.7% 2.7%<br />
Real GDP Growth<br />
<strong>2011</strong> 2012 2013 2014 2015 2016 to Cumulative Rates<br />
Probability Dec Dec Dec Dec Dec 2030 1 yr 2 yr 3 yr 5 yr 10 yr 20 yr<br />
Highest Growth 10% 3.5% 4.0% 4.4% 4.4% 4.1% 3.5% 3.5% 3.7% 4.0% 4.1% 3.8% 3.6%<br />
Higher Growth 20% 3.0% 3.5% 3.5% 3.5% 3.5% 3.2% 3.0% 3.2% 3.3% 3.4% 3.3% 3.2%<br />
Baseline 35% 2.6% 2.9% 3.1% 3.3% 3.1% 2.9% 2.6% 2.7% 2.9% 3.0% 2.9% 2.9%<br />
Lower Growth 25% 1.0% 2.0% 2.0% 2.0% 2.2% 2.4% 1.0% 1.5% 1.7% 1.8% 2.1% 2.3%<br />
Lowest Growth 10% 0.0% 1.5% 1.5% 1.5% 2.0% 2.2% 0.0% 0.7% 1.0% 1.3% 1.7% 2.0%<br />
Weighted Average 100% 2.2% 2.8% 2.9% 3.0% 3.0% 2.9% 2.2% 2.5% 2.6% 2.8% 2.8% 2.8%<br />
Page 34