Investment Plan 2011 - OPERS
Investment Plan 2011 - OPERS
Investment Plan 2011 - OPERS

Create successful ePaper yourself
Turn your PDF publications into a flip-book with our unique Google optimized e-Paper software.
Ohio Public Employees Retirement System<br />
<strong>2011</strong> Annual <strong>Investment</strong> <strong>Plan</strong><br />
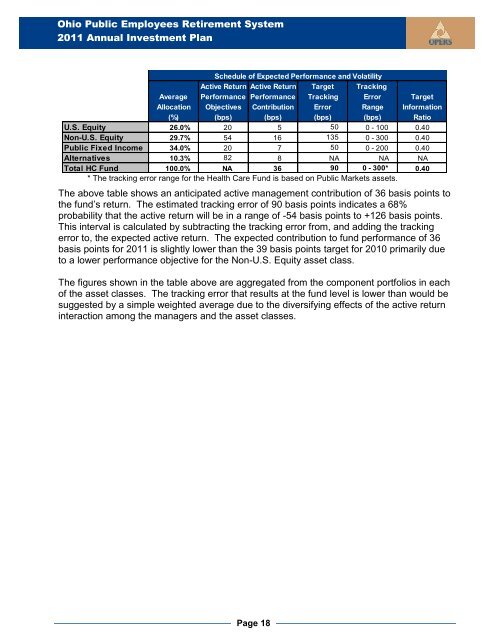
Schedule of Expected Performance and Volatility<br />
Active Return Active Return Target Tracking<br />
Average Performance Performance Tracking Error Target<br />
Allocation Objectives Contribution Error Range Information<br />
(%) (bps) (bps) (bps) (bps) Ratio<br />
U.S. Equity 26.0% 20 5 50 0 - 100 0.40<br />
Non-U.S. Equity 29.7% 54 16 135 0 - 300 0.40<br />
Public Fixed Income 34.0% 20 7 50 0 - 200 0.40<br />
Alternatives 10.3% 82 8 NA NA NA<br />
Total HC Fund 100.0% NA 36 90 0 - 300* 0.40<br />
* The tracking error range for the Health Care Fund is based on Public Markets assets.<br />
The above table shows an anticipated active management contribution of 36 basis points to<br />
the fund’s return. The estimated tracking error of 90 basis points indicates a 68%<br />
probability that the active return will be in a range of -54 basis points to +126 basis points.<br />
This interval is calculated by subtracting the tracking error from, and adding the tracking<br />
error to, the expected active return. The expected contribution to fund performance of 36<br />
basis points for <strong>2011</strong> is slightly lower than the 39 basis points target for 2010 primarily due<br />
to a lower performance objective for the Non-U.S. Equity asset class.<br />
The figures shown in the table above are aggregated from the component portfolios in each<br />
of the asset classes. The tracking error that results at the fund level is lower than would be<br />
suggested by a simple weighted average due to the diversifying effects of the active return<br />
interaction among the managers and the asset classes.<br />
Page 18