Investment Plan 2011 - OPERS
Investment Plan 2011 - OPERS
Investment Plan 2011 - OPERS

Create successful ePaper yourself
Turn your PDF publications into a flip-book with our unique Google optimized e-Paper software.
Ohio Public Employees Retirement System<br />
<strong>2011</strong> Annual <strong>Investment</strong> <strong>Plan</strong><br />
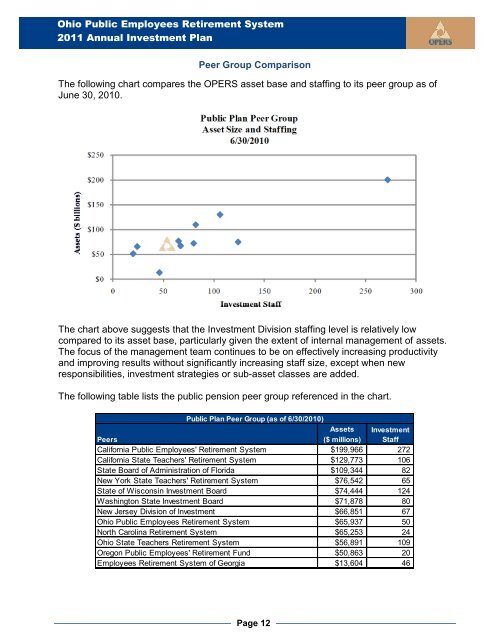
Peer Group Comparison<br />
The following chart compares the <strong>OPERS</strong> asset base and staffing to its peer group as of<br />
June 30, 2010.<br />
The chart above suggests that the <strong>Investment</strong> Division staffing level is relatively low<br />
compared to its asset base, particularly given the extent of internal management of assets.<br />
The focus of the management team continues to be on effectively increasing productivity<br />
and improving results without significantly increasing staff size, except when new<br />
responsibilities, investment strategies or sub-asset classes are added.<br />
The following table lists the public pension peer group referenced in the chart.<br />
Peers<br />
Public <strong>Plan</strong> Peer Group (as of 6/30/2010)<br />
Assets<br />
($ millions)<br />
California Public Employees' Retirement System $199,966 272<br />
California State Teachers' Retirement System $129,773 106<br />
State Board of Administration of Florida $109,344 82<br />
New York State Teachers' Retirement System $76,542 65<br />
State of Wisconsin <strong>Investment</strong> Board $74,444 124<br />
Washington State <strong>Investment</strong> Board $71,878 80<br />
New Jersey Division of <strong>Investment</strong> $66,851 67<br />
Ohio Public Employees Retirement System $65,937 50<br />
North Carolina Retirement System $65,253 24<br />
Ohio State Teachers Retirement System $56,891 109<br />
Oregon Public Employees' Retirement Fund $50,863 20<br />
Employees Retirement System of Georgia $13,604 46<br />
Page 12<br />
<strong>Investment</strong><br />
Staff