Investment Plan 2011 - OPERS
Investment Plan 2011 - OPERS
Investment Plan 2011 - OPERS

Create successful ePaper yourself
Turn your PDF publications into a flip-book with our unique Google optimized e-Paper software.
Ohio Public Employees Retirement System<br />
<strong>2011</strong> Annual <strong>Investment</strong> <strong>Plan</strong><br />
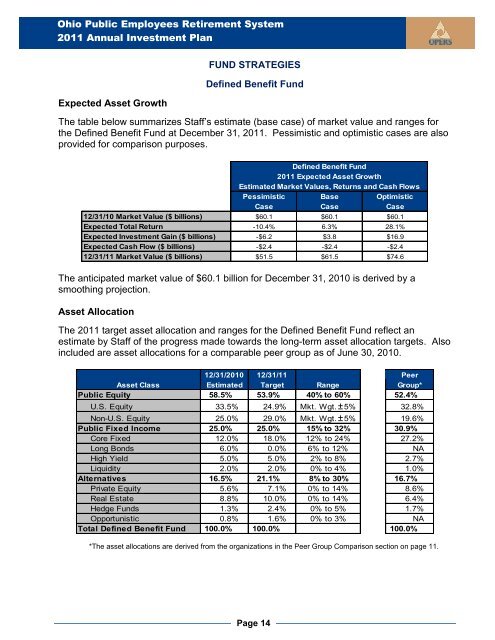
Expected Asset Growth<br />
FUND STRATEGIES<br />
Defined Benefit Fund<br />
The table below summarizes Staff’s estimate (base case) of market value and ranges for<br />
the Defined Benefit Fund at December 31, <strong>2011</strong>. Pessimistic and optimistic cases are also<br />
provided for comparison purposes.<br />
Defined Benefit Fund<br />
<strong>2011</strong> Expected Asset Growth<br />
Estimated Market Values, Returns and Cash Flows<br />
Pessimistic Base Optimistic<br />
Case Case Case<br />
12/31/10 Market Value ($ billions) $60.1 $60.1 $60.1<br />
Expected Total Return -10.4% 6.3% 28.1%<br />
Expected <strong>Investment</strong> Gain ($ billions) -$6.2 $3.8 $16.9<br />
Expected Cash Flow ($ billions) -$2.4 -$2.4 -$2.4<br />
12/31/11 Market Value ($ billions) $51.5 $61.5 $74.6<br />
The anticipated market value of $60.1 billion for December 31, 2010 is derived by a<br />
smoothing projection.<br />
Asset Allocation<br />
The <strong>2011</strong> target asset allocation and ranges for the Defined Benefit Fund reflect an<br />
estimate by Staff of the progress made towards the long-term asset allocation targets. Also<br />
included are asset allocations for a comparable peer group as of June 30, 2010.<br />
12/31/2010 12/31/11 Peer<br />
Asset Class<br />
Estimated Target Range Group*<br />
Public Equity 58.5% 53.9% 40% to 60% 52.4%<br />
U.S. Equity 33.5% 24.9% Mkt. Wgt. ± 5% 32.8%<br />
Non-U.S. Equity 25.0% 29.0% Mkt. Wgt. ± 5% 19.6%<br />
Public Fixed Income 25.0% 25.0% 15% to 32% 30.9%<br />
Core Fixed 12.0% 18.0% 12% to 24% 27.2%<br />
Long Bonds 6.0% 0.0% 6% to 12% NA<br />
High Yield 5.0% 5.0% 2% to 8% 2.7%<br />
Liquidity 2.0% 2.0% 0% to 4% 1.0%<br />
Alternatives 16.5% 21.1% 8% to 30% 16.7%<br />
Private Equity 5.6% 7.1% 0% to 14% 8.6%<br />
Real Estate 8.8% 10.0% 0% to 14% 6.4%<br />
Hedge Funds 1.3% 2.4% 0% to 5% 1.7%<br />
Opportunistic 0.8% 1.6% 0% to 3% NA<br />
Total Defined Benefit Fund 100.0% 100.0% 100.0%<br />
*The asset allocations are derived from the organizations in the Peer Group Comparison section on page 11.<br />
Page 14