Telenor's - Ericsson
Telenor's - Ericsson
Telenor's - Ericsson
- TAGS
- ericsson
- www.ericsson.com

Create successful ePaper yourself
Turn your PDF publications into a flip-book with our unique Google optimized e-Paper software.
strategy broadband<br />
Australia<br />
Population: 22.48 million<br />
Land area: 7.6 million sq km<br />
TELSTRA ANNUAL REPORT 2010<br />
▶ Annual revenues USD 21 billion<br />
▶ Number of subscribers (in millions)<br />
Basic access 8.66, fixed broadband 3.99,<br />
mobile broadband 10.56<br />
▶ Employees 31,157 (full-time staff in<br />
Australia)<br />
▶ PayTV Owns (50 percent) and operates<br />
HFC network for Foxtel<br />
▶ International operations New Zealand,<br />
China (mainland and Hong Kong)<br />
46 EBR #3 2010<br />
the majority of Australia’s traffic, currently<br />
approximately 45 petabytes per<br />
month. This figure is doubling every two to<br />
three years.<br />
ADAPTING TO BROADBAND<br />
Historically, Telstra was the incumbent ptt,<br />
with its focus squarely on telephony. The<br />
introduction of mobile phones and business<br />
data services in the 1980s and cable tv and<br />
2g mobile phones in the 1990s greatly<br />
expanded its business range. Throughout<br />
this period, and well into the 2000s,<br />
Telstra’s transmission network followed a<br />
traditional model mirroring the telephony<br />
hierarchy of local, tandem/transit and main<br />
telephony switches.<br />
The introduction and success of first generation<br />
broadband on adsl and data services<br />
on mobile networks in the early 2000s<br />
showed Telstra that fixed and mobile data/<br />
ip traffic would soon overtake telephony traffic.<br />
Also, the traditional model of adding capacity<br />
link-by-link, as needed was shown to<br />
be insufficiently flexible when planning and<br />
budgeting for transmission services. The<br />
deployment of new services was also frequently<br />
constrained and delayed by the need<br />
to expand the capacity and routes beforehand.<br />
In 2005 a new hierarchical transmission<br />
architecture was established and then progressively<br />
put in place. This program of<br />
“Ethernet enablement” matched the transition<br />
to the use of Ethernet interfaces on new<br />
ip-dslams and new 3g mobile base stations.<br />
Transmission planning was simplified<br />
through adding gigabyte capacity, rather than<br />
e1 links on specific routes.<br />
The establishment of the new architecture<br />
was followed by a two-year period of accelerated<br />
investment to realize the new model.<br />
For 2008 to 2010, capital expenditure on<br />
long-haul transmission equipment decreased<br />
somewhat – yet the capacity of the network<br />
has continued to grow to support a doubling<br />
of traffic volumes – an effective growth rate<br />
of about 30 percent a year to the end of 2009.<br />
Today, Telstra’s total traffic volume is more<br />
than 45 petabytes per month.<br />
DECOUPLING CAPACITY AND COST<br />
How has Telstra effectively decoupled capacity<br />
and capital expenditure?<br />
Between 1985 and 2000, Telstra installed<br />
sufficient fiber capacity, meaning expensive<br />
construction work for new fiber cables was<br />
rarely required. Deploying scalable capacity<br />
based on the new architecture, Telstra has<br />
been able to leverage the original investment<br />
in transmission equipment to continually increase<br />
the capacity on its existing cable plant.<br />
Added to this, the cost of capacity provided<br />
by transmission equipment has been driven<br />
down, so over the past 10 years, the cost per<br />
gigabyte has dropped considerably.<br />
Other carriers around the world lease<br />
transmission capacity from third parties. For<br />
them, the growth in broadband traffic leads<br />
to increasing operational expenditure, but<br />
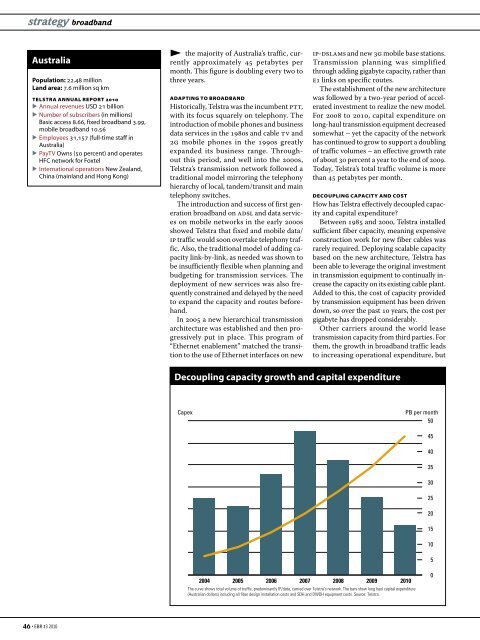
Decoupling capacity growth and capital expenditure<br />
Capex PB per month<br />
50<br />
2004 2005 2006 2007 2008 2009 2010<br />
The curve shows total volume of traffic, predominantly IP/data, carried over Telstra's network. The bars show long haul capital expenditure<br />
(Australian dollars) including all fiber design installation costs and SDH and DWDH equipment costs. Source: Telstra.<br />
45<br />
40<br />
35<br />
30<br />
25<br />
20<br />
15<br />
10<br />
5<br />
0