Press Release - Mergermarket
Press Release - Mergermarket
Press Release - Mergermarket

You also want an ePaper? Increase the reach of your titles
YUMPU automatically turns print PDFs into web optimized ePapers that Google loves.
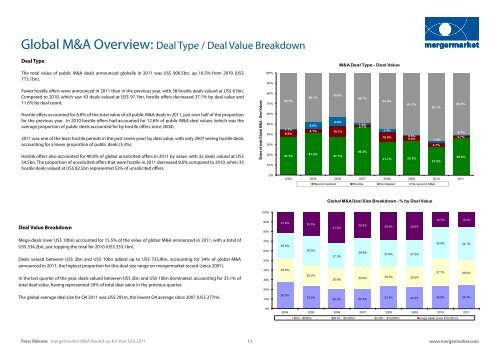
Global M&A Overview: Deal Type / Deal Value Breakdown<br />
Deal Type<br />
The total value of public M&A deals announced globally in 2011 was US$ 900.5bn, up 16.5% from 2010 (US$<br />
773.1bn).<br />
Fewer hostile offers were announced in 2011 than in the previous year, with 38 hostile deals valued at US$ 61bn.<br />
Compared to 2010, which saw 43 deals valued at US$ 97.1bn, hostile offers decreased 37.1% by deal value and<br />
11.6% by deal count.<br />
Hostile offers accounted for 6.8% of the total value of all public M&A deals in 2011, just over half of the proportion<br />
for the previous year. In 2010 hostile offers had accounted for 12.6% of public M&A deal values (which was the<br />
average proportion of public deals accounted for by hostile offers since 2004).<br />
2011 was one of the least hostile periods in the past seven years by deal value, with only 2007 seeing hostile deals<br />
accounting for a lower proportion of public deals (5.3%).<br />
Hostile offers also accounted for 49.8% of global unsolicited offers in 2011 by value, with 32 deals valued at US$<br />
54.5bn. The proportion of unsolicited offers that were hostile in 2011 decreased 8.6% compared to 2010, when 35<br />
hostile deals valued at US$ 82.5bn represented 53% of unsolicited offers.<br />
Deal Value Breakdown<br />
Mega-deals (over US$ 10bn) accounted for 15.5% of the value of global M&A announced in 2011, with a total of<br />
US$ 334.2bn, just topping the total for 2010 (US$ 333.1bn).<br />
Deals valued between US$ 2bn and US$ 10bn added up to US$ 733.9bn, accounting for 34% of global M&A<br />
announced in 2011, the highest proportion for this deal size range on mergermarket record (since 2001).<br />
In the last quarter of the year, deals valued between US$ 2bn and US$ 10bn dominated, accounting for 35.1% of<br />
total deal value, having represented 26% of total deal value in the previous quarter.<br />
The global average deal size for Q4 2011 was US$ 291m, the lowest Q4 average since 2007 (US$ 277m).<br />
Share of total Global M&A - Deal Values<br />
100%<br />
100%<br />
90%<br />
80%<br />
70%<br />
60%<br />
50%<br />
40%<br />
30%<br />
20%<br />
10%<br />
90%<br />
80%<br />
70%<br />
60%<br />
50%<br />
40%<br />
30%<br />
20%<br />
10%<br />
0%<br />
0%<br />
54.5%<br />
1.7%<br />
6.0%<br />
37.7%<br />
48.1%<br />
6.6%<br />
4.1% 10.1%<br />
41.2%<br />
43.6%<br />
8.6%<br />
37.7%<br />
M&A Deal Type - Deal Value<br />
49.7%<br />
1.4%<br />
2.7%<br />
46.2%<br />
54.9%<br />
2.4%<br />
10.9%<br />
31.7%<br />
61.3%<br />
0.5%<br />
5.0%<br />
33.2%<br />
67.1%<br />
1.2%<br />
4.1%<br />
27.5%<br />
2004 2005 2006 2007 2008 2009 2010 2011<br />
21.9%<br />
25.5%<br />
24.5%<br />
28.0%<br />
24.5%<br />
30.0%<br />
22.0%<br />
23.5%<br />
Recommended Hostile Contested Non-public M&A<br />
Global M&A Deal Size Breakdown - % by Deal Value<br />
31.9%<br />
27.3%<br />
20.8%<br />
26.8%<br />
29.8%<br />
20.0% 20.4%<br />
29.4% 29.6%<br />
27.9% 27.5%<br />
23.0% 19.3% 20.5%<br />
60.5%<br />
0.7%<br />
2.7%<br />
36.2%<br />
15.7% 15.5%<br />
32.6% 34.1%<br />
27.7% 26.0%<br />
23.4% 22.4% 24.0% 24.3%<br />
2004 2005 2006 2007 2008 2009 2010 2011<br />
$0m - $500m $501m - $2,000m $2,001 - $10,000m mega deals (over $10,001m)<br />
<strong>Press</strong> <strong>Release</strong>: mergermarket M&A Round-up for Year End 2011<br />
11<br />
www.mergermarket.com

![mergermarket [TITLE OF RELEASE TO GO HERE] 3 January 2013 ...](https://img.yumpu.com/11701841/1/190x135/mergermarket-title-of-release-to-go-here-3-january-2013-.jpg?quality=85)