Press Release - Mergermarket
Press Release - Mergermarket
Press Release - Mergermarket

You also want an ePaper? Increase the reach of your titles
YUMPU automatically turns print PDFs into web optimized ePapers that Google loves.
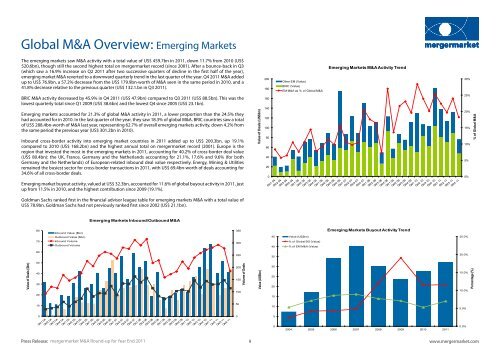
Global M&A Overview: Emerging Markets<br />
The emerging markets saw M&A activity with a total value of US$ 459.7bn in 2011, down 11.7% from 2010 (US$<br />
520.6bn), though still the second highest total on mergermarket record (since 2001). After a bounce-back in Q3<br />
(which saw a 16.9% increase on Q2 2011 after two successive quarters of decline in the first half of the year),<br />
emerging market M&A reverted to a downward quarterly trend in the last quarter of the year. Q4 2011 M&A added<br />
up to US$ 76.9bn, a 57.2% decrease from the US$ 179.9bn-worth of M&A seen in the same period in 2010, and a<br />
41.8% decrease relative to the previous quarter (US$ 132.1.bn in Q3 2011).<br />
BRIC M&A activity decreased by 45.9% in Q4 2011 (US$ 47.9bn) compared to Q3 2011 (US$ 88.5bn). This was the<br />
lowest quarterly total since Q1 2009 (US$ 38.6bn) and the lowest Q4 since 2005 (US$ 23.1bn).<br />
Emerging markets accounted for 21.3% of global M&A activity in 2011, a lower proportion than the 24.5% they<br />
had accounted for in 2010. In the last quarter of the year, they saw 18.3% of global M&A. BRIC countries saw a total<br />
of US$ 288.4bn-worth of M&A last year, representing 62.7% of overall emerging markets activity, down 4.2% from<br />
the same period the previous year (US$ 301.2bn in 2010).<br />
Inbound cross-border activity into emerging market countries in 2011 added up to US$ 200.3bn, up 19.1%<br />
compared to 2010 (US$ 168.2bn) and the highest annual total on mergermarket record (2001). Europe is the<br />
region that invested the most in the emerging markets in 2011, accounting for 40.2% of cross-border deal value<br />
(US$ 80.4bn): the UK, France, Germany and the Netherlands accounting for 21.1%, 17.6% and 9.6% (for both<br />
Germany and the Netherlands) of European-related inbound deal value respectively. Energy, Mining & Utilities<br />
remained the busiest sector for cross-border transactions in 2011, with US$ 69.4bn-worth of deals accounting for<br />
34.6% of all cross-border deals.<br />
Emerging market buyout activity, valued at US$ 32.3bn, accounted for 11.6% of global buyout activity in 2011, just<br />
up from 11.5% in 2010, and the highest contribution since 2009 (19.1%).<br />
Goldman Sachs ranked first in the financial advisor league table for emerging markets M&A with a total value of<br />
US$ 78.9bn. Goldman Sachs had not previously ranked first since 2002 (US$ 21.1bn).<br />
Value of Deals ($bn)<br />
80<br />
70<br />
60<br />
50<br />
40<br />
30<br />
20<br />
10<br />
0<br />
Inbound Value ($bn)<br />
Outbound Value ($bn)<br />
Inbound Volume<br />
Outbound Volume<br />
Emerging Markets Inbound/Outbound M&A<br />
350<br />
300<br />
250<br />
200<br />
150<br />
100<br />
50<br />
0<br />
Volume of Deals<br />
Value of Deals (US$bn)<br />
200<br />
180<br />
160<br />
140<br />
120<br />
100<br />
80<br />
60<br />
40<br />
20<br />
0<br />
Other EM (Value)<br />
BRIC (Value)<br />
EM M&A as % of Global M&A<br />
Emerging Markets M&A Activity Trend<br />
<strong>Press</strong> <strong>Release</strong>: mergermarket M&A Round-up for Year End 2011<br />
9<br />
www.mergermarket.com<br />
Value (US$bn)<br />
45<br />
40<br />
35<br />
30<br />
25<br />
20<br />
15<br />
10<br />
5<br />
0<br />
Value (US$bn)<br />
% of Global BO (Value)<br />
% of EM M&A (Value)<br />
Emerging Markets Buyout Activity Trend<br />
2004 2005 2006 2007 2008 2009 2010 2011<br />
5.0%<br />
0.0%<br />
30%<br />
25%<br />
20%<br />
15%<br />
10%<br />
5%<br />
0%<br />
25.0%<br />
20.0%<br />
15.0%<br />
10.0%<br />
Percentage (%)<br />
% of Global M&A
![mergermarket [TITLE OF RELEASE TO GO HERE] 3 January 2013 ...](https://img.yumpu.com/11701841/1/190x135/mergermarket-title-of-release-to-go-here-3-january-2013-.jpg?quality=85)