Press Release - Mergermarket
Press Release - Mergermarket
Press Release - Mergermarket

Create successful ePaper yourself
Turn your PDF publications into a flip-book with our unique Google optimized e-Paper software.
Asia-Pacific (ex. Japan) M&A Overview<br />
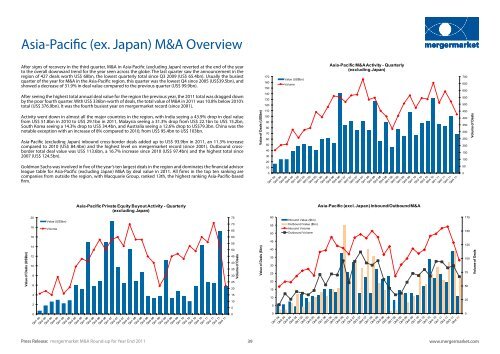
After signs of recovery in the third quarter, M&A in Asia-Pacific (excluding Japan) reverted at the end of the year<br />
to the overall downward trend for the year seen across the globe. The last quarter saw the announcement in the<br />
region of 427 deals worth US$ 68bn, the lowest quarterly total since Q3 2009 (US$ 65.4bn). Usually the busiest<br />
quarter of the year for M&A in the Asia-Pacific region, this quarter was the lowest Q4 since 2005 (US$39.5bn), and<br />
showed a decrease of 31.9% in deal value compared to the previous quarter (US$ 99.9bn).<br />
After seeing the highest total annual deal value for the region the previous year, the 2011 total was dragged down<br />
by the poor fourth quarter. With US$ 336bn-worth of deals, the total value of M&A in 2011 was 10.8% below 2010’s<br />
total (US$ 376.9bn). It was the fourth busiest year on mergermarket record (since 2001).<br />
Activity went down in almost all the major countries in the region, with India seeing a 43.9% drop in deal value<br />
from US$ 51.8bn in 2010 to US$ 29.1bn in 2011, Malaysia seeing a 31.3% drop from US$ 22.1bn to US$ 15.2bn,<br />
South Korea seeing a 14.3% drop to US$ 34.4bn, and Australia seeing a 12.6% drop to US$79.3bn. China was the<br />
notable exception with an increase of 8% compared to 2010, from US$ 95.4bn to US$ 103bn.<br />
Asia-Pacific (excluding Japan) inbound cross-border deals added up to US$ 93.9bn in 2011, an 11.3% increase<br />
compared to 2010 (US$ 84.4bn) and the highest level on mergermarket record (since 2001). Outbound crossborder<br />
total deal value was US$ 113.6bn, a 16.7% increase since 2010 (US$ 97.4bn) and the highest total since<br />
2007 (US$ 124.5bn).<br />
Goldman Sachs was involved in five of the year’s ten largest deals in the region and dominates the financial advisor<br />
league table for Asia-Pacific (excluding Japan) M&A by deal value in 2011. All firms in the top ten ranking are<br />
companies from outside the region, with Macquarie Group, ranked 13th, the highest ranking Asia-Pacific-based<br />
firm.<br />
Value of Deals (US$bn)<br />
20<br />
18<br />
16<br />
14<br />
12<br />
10<br />
8<br />
6<br />
4<br />
2<br />
0<br />
Value (US$bn)<br />
Volume<br />
Asia-Pacific Private Equity Buyout Activity - Quarterly<br />
(excluding Japan)<br />
75<br />
70<br />
65<br />
60<br />
55<br />
50<br />
45<br />
40<br />
35<br />
30<br />
25<br />
20<br />
15<br />
10<br />
5<br />
0<br />
Volume of Deals<br />
Value of Deals (US$bn)<br />
Value of Deals ($bn)<br />
170<br />
160<br />
150<br />
140<br />
130<br />
120<br />
110<br />
100<br />
90<br />
80<br />
70<br />
60<br />
50<br />
40<br />
30<br />
20<br />
10<br />
0<br />
60<br />
55<br />
50<br />
45<br />
40<br />
35<br />
30<br />
25<br />
20<br />
15<br />
10<br />
5<br />
0<br />
Value (US$bn)<br />
Volume<br />
Inbound Value ($bn)<br />
Outbound Value ($bn)<br />
Inbound Volume<br />
Outbound Volume<br />
Asia-Pacific M&A Activity - Quarterly<br />
(excluding Japan)<br />
Asia-Pacific (excl. Japan) Inbound/Outbound M&A<br />
<strong>Press</strong> <strong>Release</strong>: mergermarket M&A Round-up for Year End 2011<br />
39<br />
www.mergermarket.com<br />
700<br />
650<br />
600<br />
550<br />
500<br />
450<br />
400<br />
350<br />
300<br />
250<br />
200<br />
150<br />
100<br />
50<br />
0<br />
175<br />
150<br />
125<br />
100<br />
75<br />
50<br />
25<br />
0<br />
Volume of Deals<br />
Volume of Deals
![mergermarket [TITLE OF RELEASE TO GO HERE] 3 January 2013 ...](https://img.yumpu.com/11701841/1/190x135/mergermarket-title-of-release-to-go-here-3-january-2013-.jpg?quality=85)