Press Release - Mergermarket
Press Release - Mergermarket
Press Release - Mergermarket

You also want an ePaper? Increase the reach of your titles
YUMPU automatically turns print PDFs into web optimized ePapers that Google loves.
Global M&A Overview: Private Equity Buyouts<br />
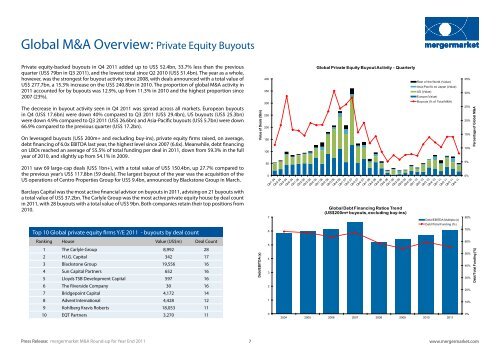
Private equity-backed buyouts in Q4 2011 added up to US$ 52.4bn, 33.7% less than the previous<br />
quarter (US$ 79bn in Q3 2011), and the lowest total since Q2 2010 (US$ 51.4bn). The year as a whole,<br />
however, was the strongest for buyout activity since 2008, with deals announced with a total value of<br />
US$ 277.7bn, a 15.3% increase on the US$ 240.8bn in 2010. The proportion of global M&A activity in<br />
2011 accounted for by buyouts was 12.9%, up from 11.3% in 2010 and the highest proportion since<br />
2007 (23%).<br />
The decrease in buyout activity seen in Q4 2011 was spread across all markets. European buyouts<br />
in Q4 (US$ 17.6bn) were down 40% compared to Q3 2011 (US$ 29.4bn), US buyouts (US$ 25.3bn)<br />
were down 4.9% compared to Q3 2011 (US$ 26.6bn) and Asia-Pacific buyouts (US$ 5.7bn) were down<br />
66.9% compared to the previous quarter (US$ 17.2bn).<br />
On leveraged buyouts (US$ 200m+ and excluding buy-ins), private equity firms raised, on average,<br />
debt financing of 6.0x EBITDA last year, the highest level since 2007 (6.6x). Meanwhile, debt financing<br />
on LBOs reached an average of 55.5% of total funding per deal in 2011, down from 59.3% in the full<br />
year of 2010, and slightly up from 54.1% in 2009.<br />
2011 saw 69 large-cap deals (US$ 1bn+), with a total value of US$ 150.4bn, up 27.7% compared to<br />
the previous year’s US$ 117.8bn (59 deals). The largest buyout of the year was the acquisition of the<br />
US operations of Centro Properties Group for US$ 9.4bn, announced by Blackstone Group in March.<br />
Barclays Capital was the most active financial advisor on buyouts in 2011, advising on 21 buyouts with<br />
a total value of US$ 37.2bn. The Carlyle Group was the most active private equity house by deal count<br />
in 2011, with 28 buyouts with a total value of US$ 9bn. Both companies retain their top positions from<br />
2010.<br />
Top 10 Global private equity firms Y/E 2011 - buyouts by deal count<br />
Ranking House Value (US$m) Deal Count<br />
1 The Carlyle Group 8,992 28<br />
2 H.I.G. Capital 342 17<br />
3 Blackstone Group 19,556 16<br />
4 Sun Capital Partners 652 16<br />
5 Lloyds TSB Development Capital 597 16<br />
6 The Riverside Company 30 16<br />
7 Bridgepoint Capital 4,172 14<br />
8 Advent International 4,428 12<br />
9 Kohlberg Kravis Roberts 18,053 11<br />
10 EQT Partners 3,270 11<br />
Value of Deals ($bn)<br />
Debt/EBITDA (x)<br />
400<br />
350<br />
300<br />
250<br />
200<br />
150<br />
100<br />
50<br />
0<br />
7<br />
6<br />
5<br />
4<br />
3<br />
2<br />
1<br />
0<br />
Global Private Equity Buyout Activity - Quarterly<br />
Global Debt Financing Ratios Trend<br />
(US$200m+ buyouts, excluding buy-ins)<br />
Rest of the World (Value)<br />
Asia-Pacific ex Japan (Value)<br />
US (Value)<br />
Europe (Value)<br />
Buyouts (% of Total M&A)<br />
Debt/EBITDA Multiple (x)<br />
Debt/Total Funding (%)<br />
2004 2005 2006 2007 2008 2009 2010 2011<br />
<strong>Press</strong> <strong>Release</strong>: mergermarket M&A Round-up for Year End 2011<br />
7<br />
www.mergermarket.com<br />
35%<br />
30%<br />
25%<br />
20%<br />
15%<br />
10%<br />
5%<br />
0%<br />
80%<br />
70%<br />
60%<br />
50%<br />
40%<br />
30%<br />
20%<br />
10%<br />
0%<br />
Percentage of Global M&A<br />
Debt/Total Funding (%)
![mergermarket [TITLE OF RELEASE TO GO HERE] 3 January 2013 ...](https://img.yumpu.com/11701841/1/190x135/mergermarket-title-of-release-to-go-here-3-january-2013-.jpg?quality=85)