Press Release - Mergermarket
Press Release - Mergermarket
Press Release - Mergermarket

Create successful ePaper yourself
Turn your PDF publications into a flip-book with our unique Google optimized e-Paper software.
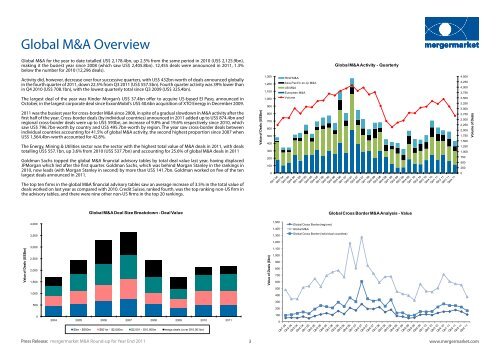
Global M&A Overview<br />
Global M&A for the year to date totalled US$ 2,178.4bn, up 2.5% from the same period in 2010 (US$ 2,125.9bn),<br />
making it the busiest year since 2008 (which saw US$ 2,405.8bn). 12,455 deals were announced in 2011, 1.3%<br />
below the number for 2010 (12,296 deals).<br />
Activity did, however, decrease over four successive quarters, with US$ 432bn-worth of deals announced globally<br />
in the fourth quarter of 2011, down 22.5% from Q3 2011 (US$ 557.5bn). Fourth quarter activity was 39% lower than<br />
in Q4 2010 (US$ 708.1bn), with the lowest quarterly total since Q3 2009 (US$ 325.4bn).<br />
The largest deal of the year was Kinder Morgan’s US$ 37.4bn offer to acquire US-based El Paso, announced in<br />
October, in the largest corporate deal since ExxonMobil’s US$ 40.6bn acquisition of XTO Energy in December 2009.<br />
2011 was the busiest year for cross-border M&A since 2008, in spite of a gradual slowdown in M&A activity after the<br />
first half of the year. Cross-border deals (by individual countries) announced in 2011 added up to US$ 874.4bn and<br />
regional cross-border deals were up to US$ 593bn, an increase of 9.8% and 19.6% respectively since 2010, which<br />
saw US$ 796.7bn-worth by country and US$ 495.7bn-worth by region. The year saw cross-border deals between<br />
individual countries accounting for 41.5% of global M&A activity, the second highest proportion since 2007 when<br />
US$ 1,564.4bn-worth accounted for 42.8%.<br />
The Energy, Mining & Utilities sector was the sector with the highest total value of M&A deals in 2011, with deals<br />
totalling US$ 557.1bn, up 3.6% from 2010 (US$ 537.7bn) and accounting for 25.6% of global M&A deals in 2011<br />
Goldman Sachs topped the global M&A financial advisory tables by total deal value last year, having displaced<br />
JPMorgan which led after the first quarter. Goldman Sachs, which was behind Morgan Stanley in the rankings in<br />
2010, now leads (with Morgan Stanley in second) by more than US$ 141.7bn. Goldman worked on five of the ten<br />
largest deals announced in 2011.<br />
The top ten firms in the global M&A financial advisory tables saw an average increase of 3.5% in the total value of<br />
deals worked on last year as compared with 2010. Credit Suisse, ranked fourth, was the top ranking non-US firm in<br />
the advisory tables, and there were nine other non-US firms in the top 20 rankings.<br />
Value of Deals (US$bn)<br />
4,000<br />
3,500<br />
3,000<br />
2,500<br />
2,000<br />
1,500<br />
1,000<br />
500<br />
0<br />
Global M&A Deal Size Breakdown - Deal Value<br />
2004 2005 2006 2007 2008 2009 2010 2011<br />
$0m - $500m $501m - $2,000m $2,001 - $10,000m mega deals (over $10,001bn)<br />
Value of Deals (US$bn)<br />
1,300<br />
1,200<br />
1,100<br />
1,000<br />
900<br />
800<br />
700<br />
600<br />
500<br />
400<br />
300<br />
200<br />
100<br />
Value of Deals ($bn)<br />
0<br />
1,500<br />
1,400<br />
1,300<br />
1,200<br />
1,100<br />
1,000<br />
900<br />
800<br />
700<br />
600<br />
500<br />
400<br />
300<br />
200<br />
100<br />
0<br />
RoW M&A<br />
Asia-Pacific ex Jp M&A<br />
US M&A<br />
European M&A<br />
Volume<br />
Global Cross Border (regions)<br />
Global M&A<br />
Global Cross Border (individual countries)<br />
Global M&A Activity - Quarterly<br />
Global Cross Border M&A Analysis - Value<br />
<strong>Press</strong> <strong>Release</strong>: mergermarket M&A Round-up for Year End 2011<br />
3<br />
www.mergermarket.com<br />
4,500<br />
4,250<br />
4,000<br />
3,750<br />
3,500<br />
3,250<br />
3,000<br />
2,750<br />
2,500<br />
2,250<br />
2,000<br />
1,750<br />
1,500<br />
1,250<br />
1,000<br />
750<br />
500<br />
250<br />
0<br />
Volume of Deals

![mergermarket [TITLE OF RELEASE TO GO HERE] 3 January 2013 ...](https://img.yumpu.com/11701841/1/190x135/mergermarket-title-of-release-to-go-here-3-january-2013-.jpg?quality=85)