Press Release - Mergermarket
Press Release - Mergermarket
Press Release - Mergermarket

You also want an ePaper? Increase the reach of your titles
YUMPU automatically turns print PDFs into web optimized ePapers that Google loves.
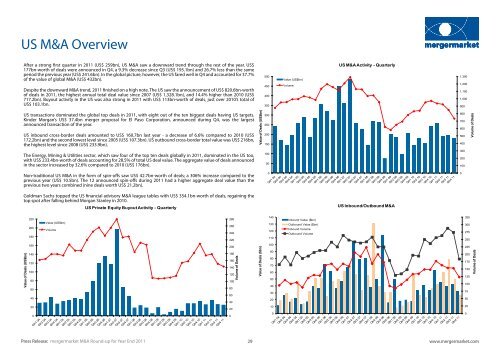
US M&A Overview<br />
After a strong first quarter in 2011 (US$ 259bn), US M&A saw a downward trend through the rest of the year. US$<br />
177bn-worth of deals were announced in Q4, a 9.3% decrease since Q3 (US$ 195.1bn) and 26.7% less than the same<br />
period the previous year (US$ 241.6bn). In the global picture, however, the US fared well in Q4 and accounted for 37.7%<br />
of the value of global M&A (US$ 432bn).<br />
Despite the downward M&A trend, 2011 finished on a high note. The US saw the announcement of US$ 820.6bn-worth<br />
of deals in 2011, the highest annual total deal value since 2007 (US$ 1,328.1bn), and 14.4% higher than 2010 (US$<br />
717.2bn). Buyout activity in the US was also strong in 2011 with US$ 113bn-worth of deals, just over 2010’s total of<br />
US$ 103.1bn.<br />
US transactions dominated the global top deals in 2011, with eight out of the ten biggest deals having US targets.<br />
Kinder Morgan’s US$ 37.4bn merger proposal for El Paso Corporation, announced during Q4, was the largest<br />
announced transaction of the year.<br />
US inbound cross-border deals amounted to US$ 160.7bn last year - a decrease of 6.6% compared to 2010 (US$<br />
172.2bn) and the second lowest level since 2005 (US$ 107.3bn). US outbound cross-border total value was US$ 216bn,<br />
the highest level since 2008 (US$ 233.9bn).<br />
The Energy, Mining & Utilities sector, which saw four of the top ten deals globally in 2011, dominated in the US too,<br />
with US$ 233.4bn-worth of deals accounting for 28.5% of total US deal value. The aggregate value of deals announced<br />
in the sector increased by 32.6% compared to 2010 (US$ 176bn).<br />
Non-traditional US M&A in the form of spin-offs saw US$ 42.7bn-worth of deals; a 306% increase compared to the<br />
previous year (US$ 10.5bn). The 12 announced spin-offs during 2011 had a higher aggregate deal value than the<br />
previous two years combined (nine deals worth US$ 21.2bn).<br />
Goldman Sachs topped the US financial advisory M&A league tables with US$ 354.1bn-worth of deals, regaining the<br />
top spot after falling behind Morgan Stanley in 2010.<br />
US Private Equity Buyout Activity - Quarterly<br />
Value of Deals (US$bn)<br />
220<br />
200<br />
180<br />
160<br />
140<br />
120<br />
100<br />
80<br />
60<br />
40<br />
20<br />
0<br />
Value (US$bn)<br />
Volume<br />
280<br />
260<br />
240<br />
220<br />
200<br />
180<br />
160<br />
140<br />
120<br />
100<br />
80<br />
60<br />
40<br />
20<br />
0<br />
Volume of Deals<br />
Value of Deals (US$bn)<br />
Value of Deals ($bn)<br />
500<br />
450<br />
400<br />
350<br />
300<br />
250<br />
200<br />
150<br />
100<br />
50<br />
0<br />
140<br />
130<br />
120<br />
110<br />
100<br />
90<br />
80<br />
70<br />
60<br />
50<br />
40<br />
30<br />
20<br />
10<br />
0<br />
Value (US$bn)<br />
Volume<br />
Inbound Value ($bn)<br />
Outbound Value ($bn)<br />
Inbound Volume<br />
Outbound Volume<br />
US M&A Activity - Quarterly<br />
US Inbound/Outbound M&A<br />
<strong>Press</strong> <strong>Release</strong>: mergermarket M&A Round-up for Year End 2011<br />
29<br />
www.mergermarket.com<br />
1,300<br />
1,200<br />
1,100<br />
1,000<br />
900<br />
800<br />
700<br />
600<br />
500<br />
400<br />
300<br />
200<br />
100<br />
0<br />
325<br />
300<br />
275<br />
250<br />
225<br />
200<br />
175<br />
150<br />
125<br />
100<br />
75<br />
50<br />
25<br />
0<br />
Volume of Deals<br />
Volume of Deals

![mergermarket [TITLE OF RELEASE TO GO HERE] 3 January 2013 ...](https://img.yumpu.com/11701841/1/190x135/mergermarket-title-of-release-to-go-here-3-january-2013-.jpg?quality=85)