Press Release - Mergermarket
Press Release - Mergermarket
Press Release - Mergermarket

You also want an ePaper? Increase the reach of your titles
YUMPU automatically turns print PDFs into web optimized ePapers that Google loves.
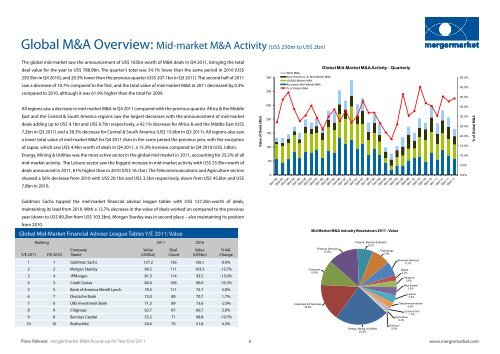
Global M&A Overview: Mid-market M&A Activity (US$ 250m to US$ 2bn)<br />
The global mid-market saw the announcement of US$ 165bn-worth of M&A deals in Q4 2011, bringing the total<br />
deal value for the year to US$ 788.9bn. The quarter’s total was 34.1% lower than the same period in 2010 (US$<br />
250.5bn in Q4 2010), and 20.3% lower than the previous quarter (US$ 207.1bn in Q3 2011). The second half of 2011<br />
saw a decrease of 10.7% compared to the first, and the total value of mid-market M&A in 2011 decreased by 0.3%<br />
compared to 2010, although it was 61.9% higher than the total for 2009.<br />
All regions saw a decrease in mid-market M&A in Q4 2011 compared with the previous quarter. Africa & the Middle<br />
East and the Central & South America regions saw the largest decreases with the announcement of mid-market<br />
deals adding up to US$ 4.1bn and US$ 9.7bn respectively, a 42.1% decrease for Africa & and the Middle East (US$<br />
7.2bn in Q3 2011) and a 38.3% decrease for Central & South America (US$ 15.6bn in Q3 2011). All regions also saw<br />
a lower total value of mid-market M&A for Q4 2011 than in the same period the previous year, with the exception<br />
of Japan, which saw US$ 4.4bn worth of deals in Q4 2011, a 15.3% increase compared to Q4 2010 (US$ 3.8bn).<br />
Energy, Mining & Utilities was the most active sector in the global mid-market in 2011, accounting for 23.2% of all<br />
mid-market activity. The Leisure sector saw the biggest increase in mid-market activity with US$ 25.9bn-worth of<br />
deals announced in 2011, 61% higher than in 2010 (US$ 16.1bn). The Telecommunications and Agriculture sectors<br />
showed a 56% decrease from 2010 with US$ 20.1bn and US$ 3.5bn respectively, down from US$ 45.6bn and US$<br />
7.8bn in 2010.<br />
Goldman Sachs topped the mid-market financial advisor league tables with US$ 127.2bn-worth of deals,<br />
maintaining its lead from 2010. With a 13.7% decrease in the value of deals worked on compared to the previous<br />
year (down to US$ 89.2bn from US$ 103.3bn), Morgan Stanley was in second place – also maintaining its position<br />
from 2010.<br />
Global Mid-Market Financial Adviser League Tables Y/E 2011: Value<br />
Ranking 2011 2010<br />
Company<br />
Value Deal<br />
Value % Val.<br />
Y/E 2011 Y/E 2010 Name<br />
(US$bn) Count (US$bn) Change<br />
1 1 Goldman Sachs 127.2 156 126.1 0.9%<br />
2 2 Morgan Stanley 89.2 111 103.3 -13.7%<br />
3 4 JPMorgan 81.3 114 93.5 -13.0%<br />
4 3 Credit Suisse 80.4 106 96.0 -16.3%<br />
5 5 Bank of America Merrill Lynch 79.5 111 75.7 5.0%<br />
6 7 Deutsche Bank 72.0 89 70.7 1.7%<br />
7 6 UBS Investment Bank 71.5 89 73.6 -2.9%<br />
8 9 Citigroup 63.7 87 60.7 5.0%<br />
9 8 Barclays Capital 55.2 71 68.8 -19.7%<br />
10 10 Rothschild 54.0 79 51.8 4.3%<br />
Value of Deals ($bn)<br />
350<br />
300<br />
250<br />
200<br />
150<br />
100<br />
50<br />
0<br />
RoW M&A<br />
Asia-Pacific ex Jp Mid-Market M&A<br />
US Mid-Market M&A<br />
European Mid-Market M&A<br />
% of Global M&A<br />
Industrials & Chemicals<br />
15.6%<br />
Global Mid-Market M&A Activity - Quarterly<br />
Mid Market M&A Industry Breakdown 2011 - Value<br />
<strong>Press</strong> <strong>Release</strong>: mergermarket M&A Round-up for Year End 2011<br />
6<br />
www.mergermarket.com<br />
Consumer<br />
10.8%<br />
Financial Services<br />
12.9%<br />
Pharma, Medical & Biotech<br />
6.7%<br />
Energy, Mining & Utilities<br />
23.2%<br />
Technology<br />
7.8%<br />
Business Services<br />
6.1%<br />
Media<br />
2.3%<br />
Transport<br />
2.8%<br />
Real Estate<br />
3.5%<br />
Leisure<br />
3.3%<br />
Telecommunications<br />
2.5%<br />
Construction<br />
1.5%<br />
Agriculture<br />
0.4%<br />
Defence<br />
0.5%<br />
50.0%<br />
45.0%<br />
40.0%<br />
35.0%<br />
30.0%<br />
25.0%<br />
20.0%<br />
15.0%<br />
10.0%<br />
5.0%<br />
0.0%<br />
% of Global M&A

![mergermarket [TITLE OF RELEASE TO GO HERE] 3 January 2013 ...](https://img.yumpu.com/11701841/1/190x135/mergermarket-title-of-release-to-go-here-3-january-2013-.jpg?quality=85)