Images - Department of Radiology & Biomedical Imaging ...
Images - Department of Radiology & Biomedical Imaging ...
Images - Department of Radiology & Biomedical Imaging ...

You also want an ePaper? Increase the reach of your titles
YUMPU automatically turns print PDFs into web optimized ePapers that Google loves.
12<br />
clinical and research news<br />
in CA1, while PTSD is characterized by neuron loss in CA3<br />
and dentate gyrus. The ability to distinguish among different<br />
patterns <strong>of</strong> hippocampal atrophy in vivo on a MRI<br />
could provide valuable information regarding the etiology<br />
<strong>of</strong> hippocampal atrophy.<br />
Progress <strong>of</strong> Structural <strong>Imaging</strong> <strong>of</strong> the Hippocampus<br />
On conventional whole brain T1 or FLAIR images at 1.5<br />
T or 3T, the resolution (typically around 1×1×1 mm) and<br />
contrast are usually not sufficient to appreciate subtle differences<br />
within the hippocampus. Consequently, it appears to<br />
be globally shrunken, <strong>of</strong>ten accompanied by an increased<br />
FLAIR signal, regardless <strong>of</strong> the underlying disease process.<br />
If discernible at all, the internal structure <strong>of</strong>ten seems to be<br />
blurred or even lost. In comparison, the appearance <strong>of</strong> an<br />
atrophied hippocampus on a dedicated, high-resolution<br />
T2 or PD-weighted fast-spin echo image obtained at 3 T or<br />
higher is strikingly different, depicting details <strong>of</strong> its internal<br />
structure (Figure 1). Even though the resolution is far<br />
from that <strong>of</strong> a histological preparation, a hypointense line<br />
representing the myelinated fibers in the stratum lacunare,<br />
moleculare, and vestiges <strong>of</strong> the hippocampus sulcus are<br />
easily and reliably recognized. The distance between this<br />
hypointense line and the outer boundary <strong>of</strong> the hippocam-<br />
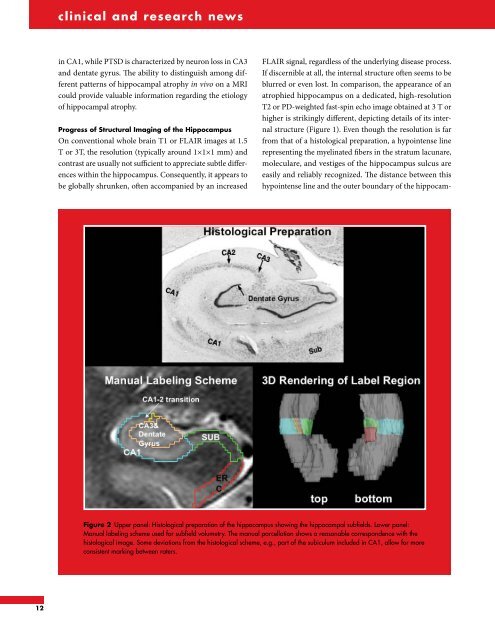
Figure 2 Upper panel: Histological preparation <strong>of</strong> the hippocampus showing the hippocampal subfields. Lower panel:<br />
Manual labeling scheme used for subfield volumetry. The manual parcellation shows a reasonable correspondence with the<br />
histological image. Some deviations from the histological scheme, e.g., part <strong>of</strong> the subiculum included in CA1, allow for more<br />
consistent marking between raters.