Images - Department of Radiology & Biomedical Imaging ...
Images - Department of Radiology & Biomedical Imaging ...
Images - Department of Radiology & Biomedical Imaging ...

You also want an ePaper? Increase the reach of your titles
YUMPU automatically turns print PDFs into web optimized ePapers that Google loves.
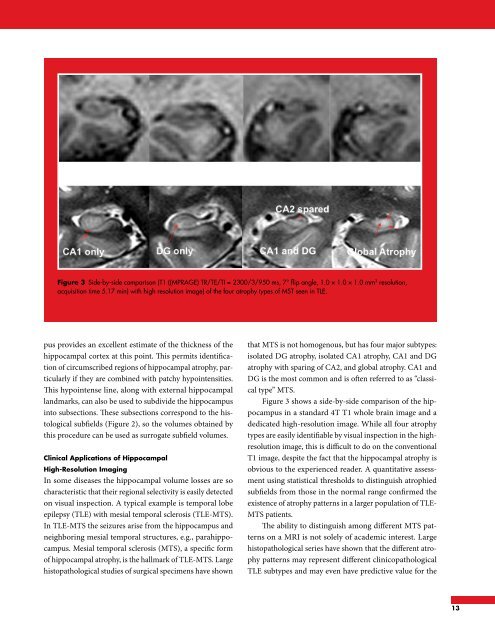
Figure 3 Side-by-side comparison (T1 ((MPRAGE) TR/TE/TI = 2300/3/950 ms, 7° flip angle, 1.0 × 1.0 × 1.0 mm 3 resolution,<br />
acquisition time 5.17 min) with high resolution image) <strong>of</strong> the four atrophy types <strong>of</strong> MST seen in TLE.<br />
pus provides an excellent estimate <strong>of</strong> the thickness <strong>of</strong> the<br />
hippocampal cortex at this point. This permits identification<br />
<strong>of</strong> circumscribed regions <strong>of</strong> hippocampal atrophy, particularly<br />
if they are combined with patchy hypointensities.<br />
This hypointense line, along with external hippocampal<br />
landmarks, can also be used to subdivide the hippocampus<br />
into subsections. These subsections correspond to the histological<br />
subfields (Figure 2), so the volumes obtained by<br />
this procedure can be used as surrogate subfield volumes.<br />
Clinical Applications <strong>of</strong> Hippocampal<br />
High-Resolution <strong>Imaging</strong><br />
In some diseases the hippocampal volume losses are so<br />
characteristic that their regional selectivity is easily detected<br />
on visual inspection. A typical example is temporal lobe<br />
epilepsy (TLE) with mesial temporal sclerosis (TLE-MTS).<br />
In TLE-MTS the seizures arise from the hippocampus and<br />
neighboring mesial temporal structures, e.g., parahippocampus.<br />
Mesial temporal sclerosis (MTS), a specific form<br />
<strong>of</strong> hippocampal atrophy, is the hallmark <strong>of</strong> TLE-MTS. Large<br />
histopathological studies <strong>of</strong> surgical specimens have shown<br />
that MTS is not homogenous, but has four major subtypes:<br />
isolated DG atrophy, isolated CA1 atrophy, CA1 and DG<br />
atrophy with sparing <strong>of</strong> CA2, and global atrophy. CA1 and<br />
DG is the most common and is <strong>of</strong>ten referred to as “classical<br />
type” MTS.<br />
Figure 3 shows a side-by-side comparison <strong>of</strong> the hippocampus<br />
in a standard 4T T1 whole brain image and a<br />
dedicated high-resolution image. While all four atrophy<br />
types are easily identifiable by visual inspection in the highresolution<br />
image, this is difficult to do on the conventional<br />
T1 image, despite the fact that the hippocampal atrophy is<br />
obvious to the experienced reader. A quantitative assessment<br />
using statistical thresholds to distinguish atrophied<br />
subfields from those in the normal range confirmed the<br />
existence <strong>of</strong> atrophy patterns in a larger population <strong>of</strong> TLE-<br />
MTS patients.<br />
The ability to distinguish among different MTS patterns<br />
on a MRI is not solely <strong>of</strong> academic interest. Large<br />
histopathological series have shown that the different atrophy<br />
patterns may represent different clinicopathological<br />
TLE subtypes and may even have predictive value for the<br />
13