INFORME TOTAL PBG.pdf - Ministerio de Economía de la Provincia ...
INFORME TOTAL PBG.pdf - Ministerio de Economía de la Provincia ...
INFORME TOTAL PBG.pdf - Ministerio de Economía de la Provincia ...

You also want an ePaper? Increase the reach of your titles
YUMPU automatically turns print PDFs into web optimized ePapers that Google loves.
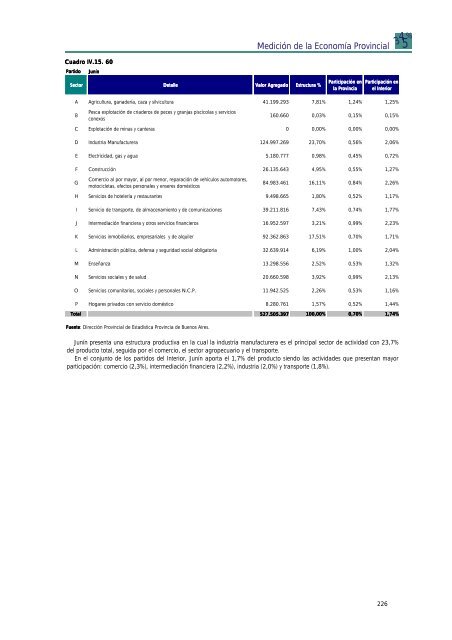
Cuadro IV.15. 60<br />
Partido Junín<br />
Sector Detalle Valor Agregado Estructura %<br />
Medición <strong>de</strong> <strong>la</strong> <strong>Economía</strong> <strong>Provincia</strong>l<br />
Participación en<br />
Participación en<br />
<strong>la</strong> <strong>Provincia</strong><br />
el Interior<br />
A Agricultura, gana<strong>de</strong>ría, caza y silvicultura 41.199.293 7,81% 1,24% 1,25%<br />
B<br />
Pesca explotación <strong>de</strong> cria<strong>de</strong>ros <strong>de</strong> peces y granjas piscíco<strong>la</strong>s y servicios<br />
conexos<br />
160.660 0,03% 0,15% 0,15%<br />
C Explotación <strong>de</strong> minas y canteras 0 0,00% 0,00% 0,00%<br />
D Industria Manufacturera 124.997.269 23,70% 0,56% 2,06%<br />
E Electricidad, gas y agua 5.180.777 0,98% 0,45% 0,72%<br />
F Construcción 26.135.643 4,95% 0,55% 1,27%<br />
G<br />
Comercio al por mayor, al por menor, reparación <strong>de</strong> vehículos automotores,<br />
motocicletas, efectos personales y enseres domésticos<br />
84.983.461 16,11% 0,84% 2,26%<br />
H Servicios <strong>de</strong> hotelería y restaurantes 9.498.665 1,80% 0,52% 1,17%<br />
I Servicio <strong>de</strong> transporte, <strong>de</strong> almacenamiento y <strong>de</strong> comunicaciones 39.211.816 7,43% 0,74% 1,77%<br />
J Intermediación financiera y otros servicios financieros 16.952.597 3,21% 0,99% 2,23%<br />
K Servicios inmobiliarios, empresariales y <strong>de</strong> alquiler 92.362.863 17,51% 0,70% 1,71%<br />
L Administración pública, <strong>de</strong>fensa y seguridad social obligatoria 32.639.914 6,19% 1,00% 2,04%<br />
M Enseñanza 13.298.556 2,52% 0,53% 1,32%<br />
N Servicios sociales y <strong>de</strong> salud 20.660.598 3,92% 0,99% 2,13%<br />
O Servicios comunitarios, sociales y personales N.C.P. 11.942.525 2,26% 0,53% 1,16%<br />
P Hogares privados con servicio doméstico 8.280.761 1,57% 0,52% 1,44%<br />
Total 527.505.397 100,00% 0,70% 1,74%<br />
Fuente: Fuente Dirección <strong>Provincia</strong>l <strong>de</strong> Estadística <strong>Provincia</strong> <strong>de</strong> Buenos Aires.<br />
Junín presenta una estructura productiva en <strong>la</strong> cual <strong>la</strong> industria manufacturera es el principal sector <strong>de</strong> actividad con 23,7%<br />
<strong>de</strong>l producto total, seguida por el comercio, el sector agropecuario y el transporte.<br />
En el conjunto <strong>de</strong> los partidos <strong>de</strong>l Interior, Junín aporta el 1,7% <strong>de</strong>l producto siendo <strong>la</strong>s activida<strong>de</strong>s que presentan mayor<br />
participación: comercio (2,3%), intermediación financiera (2,2%), industria (2,0%) y transporte (1,8%).<br />
226<br />
34 5 %