INFORME TOTAL PBG.pdf - Ministerio de Economía de la Provincia ...
INFORME TOTAL PBG.pdf - Ministerio de Economía de la Provincia ...
INFORME TOTAL PBG.pdf - Ministerio de Economía de la Provincia ...

You also want an ePaper? Increase the reach of your titles
YUMPU automatically turns print PDFs into web optimized ePapers that Google loves.
Medición <strong>de</strong> <strong>la</strong> <strong>Economía</strong> <strong>Provincia</strong>l<br />
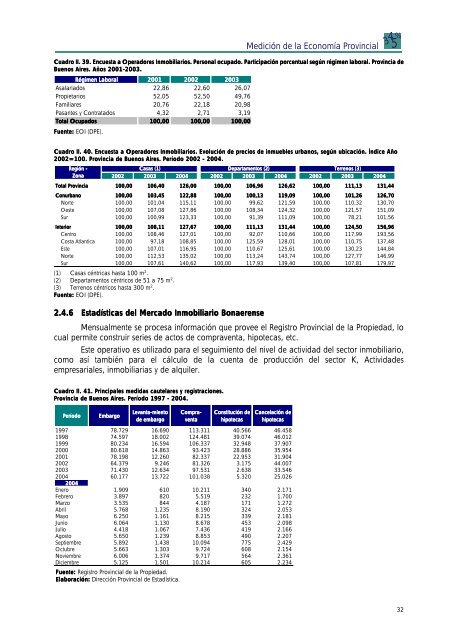
Cuadro II. 39. Encuesta a Operadores Inmobiliarios. Personal ocupado. Participación porcentual según régimen <strong>la</strong>boral. <strong>Provincia</strong> <strong>de</strong><br />
Buenos Aires. Años 2001-2003. 2001 2003.<br />
Régimen Laboral 2001 2002 2003<br />
Asa<strong>la</strong>riados 22,86 22,60 26,07<br />
Propietarios 52,05 52,50 49,76<br />
Familiares 20,76 22,18 20,98<br />
Pasantes y Contratados 4,32 2,71 3,19<br />
Total Ocupados 100,00 100,00 100,00<br />
Fuente: EOI (DPE).<br />
Cuadro II. 40. Encuesta a Operadores Inmobiliarios. Evolución <strong>de</strong> precios <strong>de</strong> inmuebles urbanos, según ubicación. Índice Año<br />
2002=100. <strong>Provincia</strong> <strong>de</strong> Buenos Aires. Período 2002 - 2004.<br />
Región -<br />
Zona<br />
Casas (1) Departamentos (2) Terrenos (3)<br />
2002 2003 2004 2002 2003 2004 2002 2003 2004<br />
Total <strong>Provincia</strong> 100,00 106,40 126,00 100,00 106,96 126,62 100,00 111,13 131,44<br />
Conurbano 100,00 103,45 122,88 100,00 100,13 119,09 100,00 101,26 126,70<br />
Norte 100,00 101,04 115,11 100,00 99,62 121,59 100,00 110,32 130,70<br />
Oeste 100,00 107,08 127,86 100,00 108,34 124,32 100,00 121,57 151,09<br />
Sur 100,00 100,99 123,33 100,00 91,39 111,09 100,00 78,21 101,56<br />
Interior 100,00 108,11 127,67 100,00 111,13 131,44 100,00 124,50 156,96<br />
Centro 100,00 108,46 127,01 100,00 92,07 110,66 100,00 117,99 193,56<br />
Costa At<strong>la</strong>ntica 100,00 97,18 108,85 100,00 125,59 128,01 100,00 110,75 137,48<br />
Este 100,00 107,01 116,95 100,00 110,67 125,61 100,00 130,23 144,84<br />
Norte 100,00 112,53 135,02 100,00 113,24 143,74 100,00 127,77 146,99<br />
Sur 100,00 107,61 140,62 100,00 117,93 139,40 100,00 107,81 179,97<br />
(1) Casas céntricas hasta 100 m2 .<br />
(2) Departamentos céntricos <strong>de</strong> 51 a 75 m2 .<br />
(3) Terrenos céntricos hasta 300 m2 .<br />
Fuente: EOI (DPE).<br />
2.4.6 Estadísticas <strong>de</strong>l Mercado Inmobiliario Bonaerense<br />
Mensualmente se procesa información que provee el Registro <strong>Provincia</strong>l <strong>de</strong> <strong>la</strong> Propiedad, lo<br />
cual permite construir series <strong>de</strong> actos <strong>de</strong> compraventa, hipotecas, etc.<br />
Este operativo es utilizado para el seguimiento <strong>de</strong>l nivel <strong>de</strong> actividad <strong>de</strong>l sector inmobiliario,<br />
como así también para el cálculo <strong>de</strong> <strong>la</strong> cuenta <strong>de</strong> producción <strong>de</strong>l sector K, Activida<strong>de</strong>s<br />
empresariales, inmobiliarias y <strong>de</strong> alquiler.<br />
Cuadro II. 41. 1. Principales medidas caute<strong>la</strong>res y registraciones<br />
registraciones.<br />
.<br />
<strong>Provincia</strong> <strong>de</strong> Buenos Aires. Período 1997 - 2004.<br />
Período Embargo<br />
Levanta-miento<br />
<strong>de</strong> embargo<br />
CompraCompraventa Constitución <strong>de</strong><br />
Cance<strong>la</strong>ción <strong>de</strong><br />
hipotecas<br />
hipotecas<br />
1997 78.729 16.690 113.311 40.566 46.458<br />
1998 74.597 18.002 124.481 39.074 46.012<br />
1999 80.234 16.594 106.337 32.948 37.907<br />
2000 80.618 14.863 93.423 28.886 35.954<br />
2001 78.198 12.260 82.337 22.953 31.904<br />
2002 64.379 9.246 81.326 3.175 44.007<br />
2003 71.430 12.634 97.531 2.638 33.546<br />
2004<br />
2004<br />
60.177 13.722 101.038 5.320 25.026<br />
Enero 1.909 610 10.211 340 2.171<br />
Febrero 3.897 820 5.519 232 1.700<br />
Marzo 3.535 844 4.187 171 1.272<br />
Abril 5.768 1.235 8.190 324 2.053<br />
Mayo 6.250 1.161 8.215 339 2.181<br />
Junio 6.064 1.130 8.678 453 2.098<br />
Julio 4.418 1.067 7.436 419 2.166<br />
Agosto 5.650 1.239 8.853 490 2.207<br />
Septiembre 5.892 1.438 10.094 775 2.429<br />
Octubre 5.663 1.303 9.724 608 2.154<br />
Noviembre<br />
Diciembre<br />
6.006<br />
5.125<br />
1.374<br />
1.501<br />
9.717<br />
10.214<br />
564<br />
605<br />
2.361<br />
2.234<br />
Fuente: Registro <strong>Provincia</strong>l <strong>de</strong> <strong>la</strong> Propiedad.<br />
E<strong>la</strong>boración: Dirección <strong>Provincia</strong>l <strong>de</strong> Estadística.<br />
34 5 %<br />
32