INFORME TOTAL PBG.pdf - Ministerio de Economía de la Provincia ...
INFORME TOTAL PBG.pdf - Ministerio de Economía de la Provincia ...
INFORME TOTAL PBG.pdf - Ministerio de Economía de la Provincia ...

You also want an ePaper? Increase the reach of your titles
YUMPU automatically turns print PDFs into web optimized ePapers that Google loves.
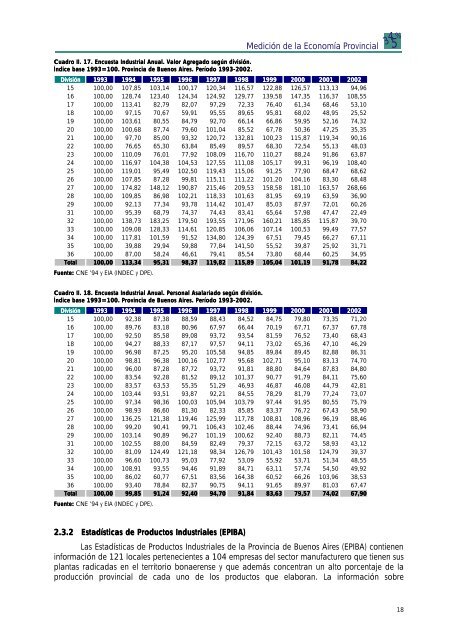
Cuadro II. 17. Encuesta Industrial Anual. Valor Agregado según división.<br />
Índice base 1993=100. <strong>Provincia</strong> <strong>de</strong> Buenos Aires. Período 1993-2002. 1993 2002.<br />
Medición <strong>de</strong> <strong>la</strong> <strong>Economía</strong> <strong>Provincia</strong>l<br />
División 1993 1994 1995 1996 1997 1998 1999 2000 2001 2002<br />
15 100,00 107,85 103,14 100,17 120,34 116,57 122,88 126,57 113,13 94,96<br />
16 100,00 128,74 123,40 124,34 124,92 129,77 139,58 147,35 116,37 108,55<br />
17 100,00 113,41 82,79 82,07 97,29 72,33 76,40 61,34 68,46 53,10<br />
18 100,00 97,15 70,67 59,91 95,55 89,65 95,81 68,02 48,95 25,52<br />
19 100,00 103,61 80,55 84,79 92,70 66,14 66,86 59,95 52,16 74,32<br />
20 100,00 100,68 87,74 79,60 101,04 85,52 67,78 50,36 47,25 35,35<br />
21 100,00 97,70 85,00 93,32 120,72 132,81 100,23 115,87 119,34 90,16<br />
22 100,00 76,65 65,30 63,84 85,49 89,57 68,30 72,54 55,13 48,03<br />
23 100,00 110,09 76,01 77,92 108,09 116,70 110,27 88,24 91,86 63,87<br />
24 100,00 116,97 104,38 104,53 127,55 111,08 105,17 99,31 96,19 108,40<br />
25 100,00 119,01 95,49 102,50 119,43 115,06 91,25 77,90 68,47 68,62<br />
26 100,00 107,85 87,28 99,81 115,11 111,22 101,20 104,16 83,30 68,48<br />
27 100,00 174,82 148,12 190,87 215,46 209,53 158,58 181,10 163,57 268,66<br />
28 100,00 109,85 86,98 102,21 118,33 101,63 81,95 69,19 63,59 36,90<br />
29 100,00 92,13 77,34 93,78 114,42 101,47 85,03 87,97 72,01 60,26<br />
31 100,00 95,39 68,79 74,37 74,43 83,41 65,64 57,98 47,47 22,49<br />
32 100,00 138,73 183,25 179,50 193,55 171,96 160,21 185,85 115,87 39,70<br />
33 100,00 109,08 128,33 114,61 120,85 106,06 107,14 100,53 99,49 77,57<br />
34 100,00 117,81 101,59 91,52 134,80 124,39 67,51 79,45 66,27 67,11<br />
35 100,00 39,88 29,94 59,88 77,84 141,50 55,52 39,87 25,92 31,71<br />
36 100,00 87,00 58,24 46,61 79,41 85,54 73,80 68,44 60,25 34,95<br />
Total 100,00 113,34 95,31 98,37 119,82 115,89 105,04 101,19 91,78 84,22<br />
Fuente: CNE ’94 y EIA (INDEC y DPE).<br />
Cuadro II. 18. Encuesta Industrial Anual. Personal Asa<strong>la</strong>riado según división.<br />
Índice base 1993=100. <strong>Provincia</strong> <strong>de</strong> Buenos Aires. Período 1993-200 1993 2002. 2.<br />
División 1993 1994 1995 1996 1997 1998 1999 2000 2001 2002<br />
15 100,00 92,38 87,38 88,59 88,43 84,52 84,75 79,80 73,35 71,20<br />
16 100,00 89,76 83,18 80,96 67,97 66,44 70,19 67,71 67,37 67,78<br />
17 100,00 92,50 85,58 89,08 93,72 93,54 81,59 76,52 73,40 68,43<br />
18 100,00 94,27 88,33 87,17 97,57 94,11 73,02 65,36 47,10 46,29<br />
19 100,00 96,98 87,25 95,20 105,58 94,85 89,84 89,45 82,88 86,31<br />
20 100,00 98,81 96,38 100,16 102,77 95,68 102,71 95,10 83,13 74,70<br />
21 100,00 96,00 87,28 87,72 93,72 91,81 88,80 84,64 87,83 84,80<br />
22 100,00 83,54 92,28 81,52 89,12 101,37 90,77 91,79 84,11 75,60<br />
23 100,00 83,57 63,53 55,35 51,29 46,93 46,87 46,08 44,79 42,81<br />
24 100,00 103,44 93,51 93,87 92,21 84,55 78,29 81,79 77,24 73,07<br />
25 100,00 97,34 98,36 100,03 105,94 103,79 97,44 91,95 80,55 75,79<br />
26 100,00 98,93 86,60 81,30 82,33 85,85 83,37 76,72 67,43 58,90<br />
27 100,00 136,25 121,38 119,46 125,99 117,78 108,81 108,96 96,19 88,46<br />
28 100,00 99,20 90,41 99,71 106,43 102,46 88,44 74,96 73,41 66,94<br />
29 100,00 103,14 90,89 96,27 101,19 100,62 92,40 88,73 82,11 74,45<br />
31 100,00 102,55 88,00 84,59 82,49 79,37 72,15 63,72 58,93 43,12<br />
32 100,00 81,09 124,49 121,18 98,34 126,79 101,43 101,58 124,79 39,37<br />
33 100,00 96,60 100,73 95,03 77,92 53,09 55,92 53,71 51,34 48,55<br />
34 100,00 108,91 93,55 94,46 91,89 84,71 63,11 57,74 54,50 49,92<br />
35 100,00 86,02 60,77 67,51 83,56 164,38 60,52 66,26 103,96 38,53<br />
36 100,00 93,40 78,84 82,37 90,75 94,11 91,65 89,97 81,03 67,47<br />
Total 100,00 99,85 91,24 92,40 94,70 91,84 83,63 79,57 74,02 67,90<br />
Fuente: CNE ’94 y EIA (INDEC y DPE).<br />
2.3.2 Estadísticas <strong>de</strong> Productos Industriales (EPIBA)<br />
Las Estadísticas <strong>de</strong> Productos Industriales <strong>de</strong> <strong>la</strong> <strong>Provincia</strong> <strong>de</strong> Buenos Aires (EPIBA) contienen<br />
información <strong>de</strong> 121 locales pertenecientes a 104 empresas <strong>de</strong>l sector manufacturero que tienen sus<br />
p<strong>la</strong>ntas radicadas en el territorio bonaerense y que a<strong>de</strong>más concentran un alto porcentaje <strong>de</strong> <strong>la</strong><br />
producción provincial <strong>de</strong> cada uno <strong>de</strong> los productos que e<strong>la</strong>boran. La información sobre<br />
34 5 %<br />
18