plan estratégico para el drenaje pluvial del sur de ... - sinat - Semarnat
plan estratégico para el drenaje pluvial del sur de ... - sinat - Semarnat
plan estratégico para el drenaje pluvial del sur de ... - sinat - Semarnat

Create successful ePaper yourself
Turn your PDF publications into a flip-book with our unique Google optimized e-Paper software.
IV.2.4 Medio socioeconómico<br />
a) Demografía.<br />
MANIFESTACIÓN DE IMPACTO AMBIENTAL MODALIDAD PARTICULAR SECTOR HIDRÁULICO<br />
PROYECTO. PLAN ESTRATÉGICO PARA EL DRENAJE PLUVIAL DEL SUR DE TAMAULIPAS:<br />
OBRAS DE DRENAJE PLUVIAL EN LA DIVISORIA TAMPICO-ALTAMIRA, EN ALTAMIRA, TAM.<br />
OBRAS PARA EL DRENAJE PLUVIAL EN LA CALLE ALDAMA EN CD MADERO Y TAMPICO, TAM.<br />
AMPLIACIÓN DEL DREN DE LA COL. MORELOS Y CONSTRUCCIÓN DE DRENES EN LA ZONA CENTRO, CALLE<br />
ESPERANZA, BENITO JUÁREZ, COLÓN, Y PERIMETRAL FIDEL VELÁZQUEZ, EN TAMPICO, TAM.<br />
INSTITUTO METROPOLITANO DE PLANEACIÓN DEL SUR DE TAMAULIPAS<br />
Dinámica <strong>de</strong> la población <strong>de</strong> las comunida<strong>de</strong>s directa o indirectamente<br />
afectadas con <strong>el</strong> proyecto<br />
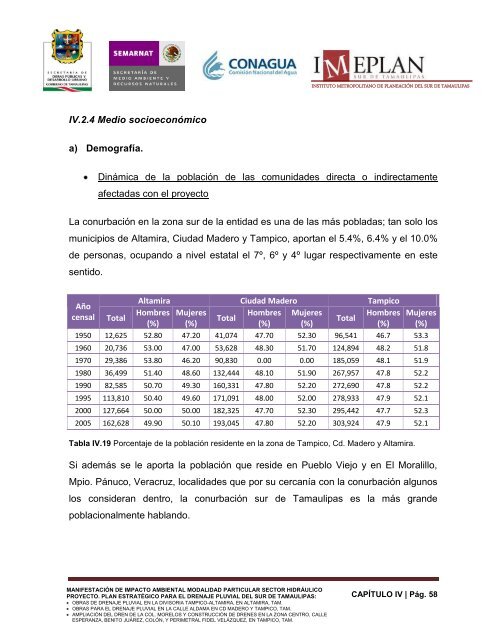
La conurbación en la zona <strong>sur</strong> <strong>de</strong> la entidad es una <strong>de</strong> las más pobladas; tan solo los<br />
municipios <strong>de</strong> Altamira, Ciudad Ma<strong>de</strong>ro y Tampico, aportan <strong>el</strong> 5.4%, 6.4% y <strong>el</strong> 10.0%<br />
<strong>de</strong> personas, ocupando a niv<strong>el</strong> estatal <strong>el</strong> 7º, 6º y 4º lugar respectivamente en este<br />
sentido.<br />
Año<br />
censal Total<br />
Altamira Ciudad Ma<strong>de</strong>ro Tampico<br />
Hombres Mujeres<br />
(%) (%)<br />
Total Hombres Mujeres<br />
(%) (%)<br />
Total Hombres Mujeres<br />
(%) (%)<br />
1950 12,625 52.80 47.20 41,074 47.70 52.30 96,541 46.7 53.3<br />
1960 20,736 53.00 47.00 53,628 48.30 51.70 124,894 48.2 51.8<br />
1970 29,386 53.80 46.20 90,830 0.00 0.00 185,059 48.1 51.9<br />
1980 36,499 51.40 48.60 132,444 48.10 51.90 267,957 47.8 52.2<br />
1990 82,585 50.70 49.30 160,331 47.80 52.20 272,690 47.8 52.2<br />
1995 113,810 50.40 49.60 171,091 48.00 52.00 278,933 47.9 52.1<br />
2000 127,664 50.00 50.00 182,325 47.70 52.30 295,442 47.7 52.3<br />
2005 162,628 49.90 50.10 193,045 47.80 52.20 303,924 47.9 52.1<br />
Tabla IV.19 Porcentaje <strong>de</strong> la población resi<strong>de</strong>nte en la zona <strong>de</strong> Tampico, Cd. Ma<strong>de</strong>ro y Altamira.<br />
Si a<strong>de</strong>más se le aporta la población que resi<strong>de</strong> en Pueblo Viejo y en El Moralillo,<br />
Mpio. Pánuco, Veracruz, localida<strong>de</strong>s que por su cercanía con la conurbación algunos<br />
los consi<strong>de</strong>ran <strong>de</strong>ntro, la conurbación <strong>sur</strong> <strong>de</strong> Tamaulipas es la más gran<strong>de</strong><br />
poblacionalmente hablando.<br />
CAPÍTULO IV | Pág. 58