- Page 1 and 2:
INSTITUTO METROPOLITANO DE PLANEACI
- Page 3 and 4:
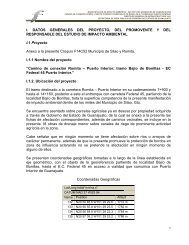
I.2.4.3 Código postal 87130 I.2.4.
- Page 5 and 6:
Responsable del proyecto Participan
- Page 7 and 8:
INSTITUTO METROPOLITANO DE PLANEACI
- Page 9 and 10:
DRENAJE PLUVIAL EN LA DIVISORIA TAM
- Page 11 and 12:
INSTITUTO METROPOLITANO DE PLANEACI
- Page 13 and 14:
INSTITUTO METROPOLITANO DE PLANEACI
- Page 15 and 16:
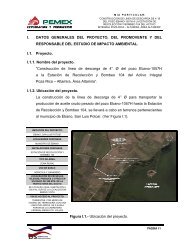
Figura II.2 Localización general d
- Page 17 and 18:
Vértice Este Norte Componente* Div
- Page 19 and 20:
Obra Parcial MANIFESTACIÓN DE IMPA
- Page 21 and 22:
1. 2. 3. Proyecto Ducto simple de s
- Page 23 and 24:
1. 1a 1b 2. 2a 2b 3. 3a 3b Proyecto
- Page 25 and 26:
Obra Usos y destinos Obra Ampliaci
- Page 27 and 28:
INSTITUTO METROPOLITANO DE PLANEACI
- Page 29 and 30:
MANIFESTACIÓN DE IMPACTO AMBIENTAL
- Page 31 and 32:
II.2 Características particulares
- Page 33 and 34:
INSTITUTO METROPOLITANO DE PLANEACI
- Page 35 and 36:
Figura II.8 Planta general de los e
- Page 37 and 38:
INSTITUTO METROPOLITANO DE PLANEACI
- Page 39 and 40:
Figura II.9 Planta general de los e
- Page 41 and 42:
INSTITUTO METROPOLITANO DE PLANEACI
- Page 43 and 44:
Colonia Morelos: UN COLECTOR MANIFE
- Page 45 and 46:
II.2.1 Programa General de Trabajo
- Page 47 and 48:
DESHIERBE Y RETIRO DE MALEZAS MANIF
- Page 49 and 50:
INSTITUTO METROPOLITANO DE PLANEACI
- Page 51 and 52:
INSTITUTO METROPOLITANO DE PLANEACI
- Page 53 and 54:
INSTITUTO METROPOLITANO DE PLANEACI
- Page 55 and 56:
INSTITUTO METROPOLITANO DE PLANEACI
- Page 57 and 58:
INSTITUTO METROPOLITANO DE PLANEACI
- Page 59 and 60:
Figura II.13 Caja de caída. MANIFE
- Page 61 and 62:
IMBORNAL MANIFESTACIÓN DE IMPACTO
- Page 63 and 64:
Figura II.15 Arreglo tipo imbornal
- Page 65 and 66:
En toda tubería fabricada con petr
- Page 67 and 68:
INSTITUTO METROPOLITANO DE PLANEACI
- Page 69 and 70:
Para realizar un buen mantenimiento
- Page 71 and 72:
No. en figura MANIFESTACIÓN DE IMP
- Page 73 and 74:
INSTITUTO METROPOLITANO DE PLANEACI
- Page 75 and 76:
INSTITUTO METROPOLITANO DE PLANEACI
- Page 77 and 78:
ETAPA DE MANTENIMIENTO RESIDUOS SOL
- Page 79 and 80:
INSTITUTO METROPOLITANO DE PLANEACI
- Page 81 and 82:
CAPÍTULO 3. OBJETIVOS RECTORES DEL
- Page 83 and 84:
Planes y Programas de Desarrollo Ur
- Page 85 and 86:
INSTITUTO METROPOLITANO DE PLANEACI
- Page 87 and 88:
Planes y Programas de Desarrollo Ur
- Page 89 and 90:
III. Los Ayuntamientos, y IV. Los o
- Page 91 and 92:
INSTITUTO METROPOLITANO DE PLANEACI
- Page 93 and 94:
MANIFESTACIÓN DE IMPACTO AMBIENTAL
- Page 95 and 96:
Tabla 1 MANIFESTACIÓN DE IMPACTO A
- Page 97 and 98:
INSTITUTO METROPOLITANO DE PLANEACI
- Page 99 and 100:
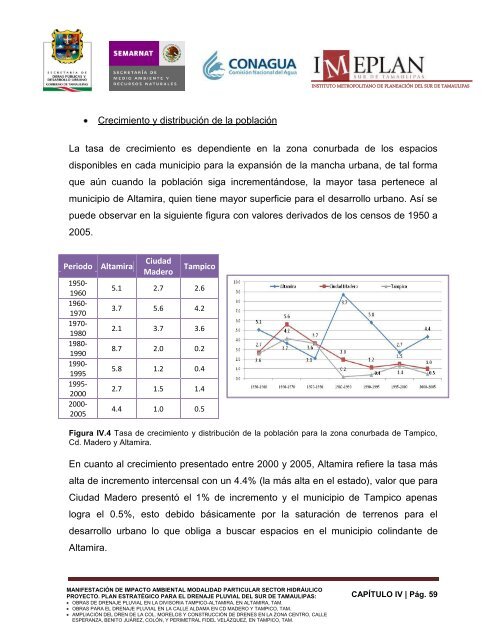
IV.2 Caracterización y análisis d
- Page 101 and 102:
MANIFESTACIÓN DE IMPACTO AMBIENTAL
- Page 103 and 104: MANIFESTACIÓN DE IMPACTO AMBIENTAL
- Page 105 and 106: Gráfica IV.3 Presencia de días co
- Page 107 and 108: INSTITUTO METROPOLITANO DE PLANEACI
- Page 109 and 110: INSTITUTO METROPOLITANO DE PLANEACI
- Page 111 and 112: INSTITUTO METROPOLITANO DE PLANEACI
- Page 113 and 114: INSTITUTO METROPOLITANO DE PLANEACI
- Page 115 and 116: INSTITUTO METROPOLITANO DE PLANEACI
- Page 117 and 118: MANIFESTACIÓN DE IMPACTO AMBIENTAL
- Page 119 and 120: INSTITUTO METROPOLITANO DE PLANEACI
- Page 121 and 122: INSTITUTO METROPOLITANO DE PLANEACI
- Page 123 and 124: IV.2.2 Aspectos Bióticos a) Vegeta
- Page 125 and 126: (Ruellia nudiflora) Petunia silvest
- Page 127 and 128: (Dactyloctenium aegyptium) Zacate e
- Page 129 and 130: fagara). MANIFESTACIÓN DE IMPACTO
- Page 131 and 132: que su producción en México depen
- Page 133 and 134: Chenchrus ciliaris Zacate buffel Pa
- Page 135 and 136: INSTITUTO METROPOLITANO DE PLANEACI
- Page 137 and 138: Drenaje Pluvial Divisoria Tampico-A
- Page 139 and 140: INSTITUTO METROPOLITANO DE PLANEACI
- Page 141 and 142: INSTITUTO METROPOLITANO DE PLANEACI
- Page 143 and 144: Kinosternon acutum Tortuga pecho qu
- Page 145 and 146: Sterna sandvicensis Charrán de san
- Page 147 and 148: Toxostoma curvirostre Cuitlacoche x
- Page 149 and 150: Natalus stramineus Murciélago orej
- Page 151 and 152: INSTITUTO METROPOLITANO DE PLANEACI
- Page 153: IV.2.3 Paisaje MANIFESTACIÓN DE IM
- Page 157 and 158: MANIFESTACIÓN DE IMPACTO AMBIENTAL
- Page 159 and 160: INSTITUTO METROPOLITANO DE PLANEACI
- Page 161 and 162: tanto en el D.F, como en el Estado
- Page 163 and 164: 13.9% MANIFESTACIÓN DE IMPACTO AMB
- Page 165 and 166: Agric., ganad., silvicultura, caza
- Page 167 and 168: MANIFESTACIÓN DE IMPACTO AMBIENTAL
- Page 169 and 170: INSTITUTO METROPOLITANO DE PLANEACI
- Page 171 and 172: IV.3 Diagnóstico Ambiental MANIFES
- Page 173 and 174: INSTITUTO METROPOLITANO DE PLANEACI
- Page 175 and 176: INSTITUTO METROPOLITANO DE PLANEACI
- Page 177 and 178: V.1.2. Criterios y metodologías de
- Page 179 and 180: Tabla V.3 Importancia del impacto N
- Page 181 and 182: INSTITUTO METROPOLITANO DE PLANEACI
- Page 183 and 184: INSTITUTO METROPOLITANO DE PLANEACI
- Page 185 and 186: Obras Proyecto que llevará a cabo
- Page 187 and 188: MEDIO FACTORES AMBIENTALES FACTOR S
- Page 189 and 190: MEDIO FACTORES AMBIENTALES FACTOR S
- Page 191 and 192: MEDIO FACTORES AMBIENTALES FACTOR S
- Page 193 and 194: MANIFESTACIÓN DE IMPACTO AMBIENTAL
- Page 195 and 196: FACTORES AMBIENTALES MEDIO FACTOR S
- Page 197 and 198: FACTORES AMBIENTALES MEDIO FACTOR S
- Page 199 and 200: V.3 Evaluación de impactos ambient
- Page 201 and 202: MANIFESTACIÓN DE IMPACTO AMBIENTAL
- Page 203 and 204: ETAPA PREPARACION DEL SITIO CONSTRU
- Page 205 and 206:
V.4 Descripción de impactos ambien
- Page 207 and 208:
SUBFACTOR (CO, NOx, SOx, HC, humos)
- Page 209 and 210:
FACTOR Agua (etapa de construcción
- Page 211 and 212:
MEDIO Biótico FACTOR Vegetación (
- Page 213 and 214:
INSTITUTO METROPOLITANO DE PLANEACI
- Page 215 and 216:
FACTOR Equipamiento y Servicios (et
- Page 217 and 218:
V.4.2 Etapa de Operación y Manteni
- Page 219 and 220:
MEDIO Inerte SUBSISTEMA NATURAL FAC
- Page 221 and 222:
INSTITUTO METROPOLITANO DE PLANEACI
- Page 223 and 224:
INSTITUTO METROPOLITANO DE PLANEACI
- Page 225 and 226:
MEDIO Perceptual FACTOR Paisaje int
- Page 227 and 228:
INSTITUTO METROPOLITANO DE PLANEACI
- Page 229 and 230:
INSTITUTO METROPOLITANO DE PLANEACI
- Page 231 and 232:
INSTITUTO METROPOLITANO DE PLANEACI
- Page 233 and 234:
V.5. Análisis de los Impactos Ambi
- Page 235 and 236:
INSTITUTO METROPOLITANO DE PLANEACI
- Page 237 and 238:
FACTOR TIERRA - SUELO SUBFACTOR: Co
- Page 239 and 240:
FACTOR SOCIOECONOMICO SUBFACTOR: Em
- Page 241 and 242:
Impacto Interacción con factores a
- Page 243 and 244:
Impacto Interacción con factores a
- Page 245 and 246:
ETAPA PREPARACION DEL SITIO CONSTRU
- Page 247 and 248:
ETAPA MANTENIMIENTO OPERACIÓN ACTI
- Page 249 and 250:
MANIFESTACIÓN DE IMPACTO AMBIENTAL
- Page 251 and 252:
MANIFESTACIÓN DE IMPACTO AMBIENTAL
- Page 253 and 254:
MANIFESTACIÓN DE IMPACTO AMBIENTAL
- Page 255 and 256:
MANIFESTACIÓN DE IMPACTO AMBIENTAL
- Page 257 and 258:
MANIFESTACIÓN DE IMPACTO AMBIENTAL
- Page 259 and 260:
MANIFESTACIÓN DE IMPACTO AMBIENTAL
- Page 261 and 262:
MANIFESTACIÓN DE IMPACTO AMBIENTAL
- Page 263 and 264:
MANIFESTACIÓN DE IMPACTO AMBIENTAL
- Page 265 and 266:
MANIFESTACIÓN DE IMPACTO AMBIENTAL
- Page 267 and 268:
LINEA ESTRATÉGICA: EVITAR LA CONTA
- Page 269 and 270:
LÍNEA ESTRATÉGICA: MODIFICACION A
- Page 271 and 272:
LÍNEA ESTRATÉGICA: MEDIDAS PREVEN
- Page 273 and 274:
MEDIO INFRAESTRUCTURA Y SERVICIOS:
- Page 275 and 276:
LÍNEA ESTRATÉGICA: RESTAURAR DAÑ
- Page 277 and 278:
VI.2 Impactos residuales MANIFESTAC
- Page 279 and 280:
Operación de los drenes pluviales
- Page 281 and 282:
MANIFESTACIÓN DE IMPACTO AMBIENTAL
- Page 283 and 284:
MANIFESTACIÓN DE IMPACTO AMBIENTAL
- Page 285 and 286:
Aspecto Impacto Control y seguimien
- Page 287 and 288:
VII.3 Conclusiones MANIFESTACIÓN D
- Page 289 and 290:
MANIFESTACIÓN DE IMPACTO AMBIENTAL
- Page 291 and 292:
VIII.1.3 Videos No se anexan videos
- Page 293 and 294:
MANIFESTACIÓN DE IMPACTO AMBIENTAL
- Page 295 and 296:
MANIFESTACIÓN DE IMPACTO AMBIENTAL