impacto del capital humano en el crecimiento econmico ... - Biblioteca
impacto del capital humano en el crecimiento econmico ... - Biblioteca
impacto del capital humano en el crecimiento econmico ... - Biblioteca

Create successful ePaper yourself
Turn your PDF publications into a flip-book with our unique Google optimized e-Paper software.
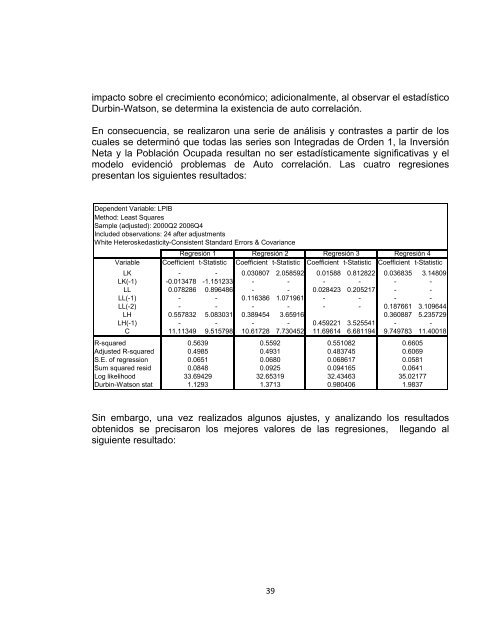
<strong>impacto</strong> sobre <strong>el</strong> crecimi<strong>en</strong>to económico; adicionalm<strong>en</strong>te, al observar <strong>el</strong> estadístico<br />
Durbin-Watson, se determina la exist<strong>en</strong>cia de auto corr<strong>el</strong>ación.<br />
En consecu<strong>en</strong>cia, se realizaron una serie de análisis y contrastes a partir de los<br />
cuales se determinó que todas las series son Integradas de Ord<strong>en</strong> 1, la Inversión<br />
Neta y la Población Ocupada resultan no ser estadísticam<strong>en</strong>te significativas y <strong>el</strong><br />
mo<strong>d<strong>el</strong></strong>o evid<strong>en</strong>ció problemas de Auto corr<strong>el</strong>ación. Las cuatro regresiones<br />
pres<strong>en</strong>tan los sigui<strong>en</strong>tes resultados:<br />
Dep<strong>en</strong>d<strong>en</strong>t Variable: LPIB<br />
Method: Least Squares<br />
Sample (adjusted): 2000Q2 2006Q4<br />
Included observations: 24 after adjustm<strong>en</strong>ts<br />
White Heteroskedasticity-Consist<strong>en</strong>t Standard Errors & Covariance<br />
Regresión 1 Regresión 2 Regresión 3 Regresión 4<br />
Variable Coeffici<strong>en</strong>t t-Statistic Coeffici<strong>en</strong>t t-Statistic Coeffici<strong>en</strong>t t-Statistic Coeffici<strong>en</strong>t t-Statistic<br />
LK - - 0.030807 2.058592 0.01588 0.812822 0.036835 3.14809<br />
LK(-1) -0.013478 -1.151233 - - - - - -<br />
LL 0.078286 0.896486 - - 0.028423 0.205217 - -<br />
LL(-1) - - 0.116386 1.071961 - - - -<br />
LL(-2) - - - - - - 0.187661 3.109644<br />
LH 0.557832 5.083031 0.389454 3.65916 0.360887 5.235729<br />
LH(-1) - - - - 0.459221 3.525541 - -<br />
C 11.11349 9.515798 10.61728 7.730452 11.69614 6.681194 9.749783 11.40018<br />
R-squared<br />
Adjusted R-squared<br />
S.E. of regression<br />
Sum squared resid<br />
Log lik<strong>el</strong>ihood<br />
Durbin-Watson stat<br />
0.5639<br />
0.4985<br />
0.0651<br />
0.0848<br />
33.69429<br />
1.1293<br />
0.5592<br />
0.4931<br />
0.0680<br />
0.0925<br />
32.65319<br />
1.3713<br />
0.551082<br />
0.483745<br />
0.068617<br />
0.094165<br />
32.43463<br />
0.980406<br />
0.6605<br />
0.6069<br />
0.0581<br />
0.0641<br />
35.02177<br />
1.9837<br />
Sin embargo, una vez realizados algunos ajustes, y analizando los resultados<br />
obt<strong>en</strong>idos se precisaron los mejores valores de las regresiones, llegando al<br />
sigui<strong>en</strong>te resultado:<br />
39