Pobreza Urbana en la Argentina - del Centro de Documentación e ...
Pobreza Urbana en la Argentina - del Centro de Documentación e ...
Pobreza Urbana en la Argentina - del Centro de Documentación e ...

You also want an ePaper? Increase the reach of your titles
YUMPU automatically turns print PDFs into web optimized ePapers that Google loves.
Departam<strong>en</strong>to <strong>de</strong> Investigación Institucional<br />
- Área Sociológica -<br />
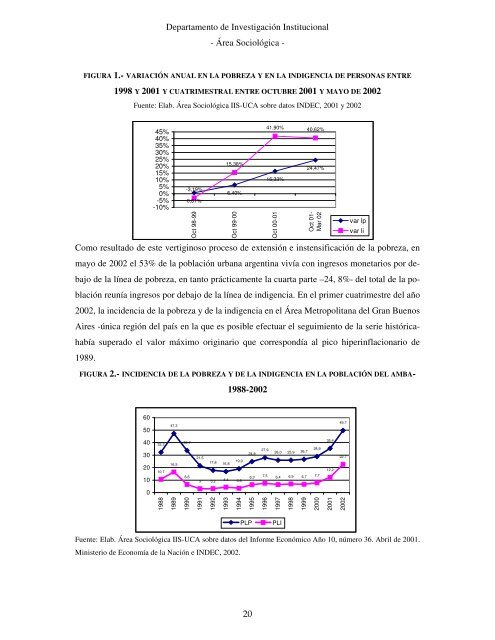
FIGURA 1.- VARIACIÓN ANUAL EN LA POBREZA Y EN LA INDIGENCIA DE PERSONAS ENTRE<br />
1998 Y 2001 Y CUATRIMESTRAL ENTRE OCTUBRE 2001 Y MAYO DE 2002<br />
Fu<strong>en</strong>te: E<strong>la</strong>b. Área Sociológica IIS-UCA sobre datos INDEC, 2001 y 2002<br />
Como resultado <strong>de</strong> este vertiginoso proceso <strong>de</strong> ext<strong>en</strong>sión e inst<strong>en</strong>sificación <strong>de</strong> <strong>la</strong> pobreza, <strong>en</strong><br />
mayo <strong>de</strong> 2002 el 53% <strong>de</strong> <strong>la</strong> pob<strong>la</strong>ción urbana arg<strong>en</strong>tina vivía con ingresos monetarios por <strong>de</strong>-<br />
bajo <strong>de</strong> <strong>la</strong> línea <strong>de</strong> pobreza, <strong>en</strong> tanto prácticam<strong>en</strong>te <strong>la</strong> cuarta parte –24, 8%- <strong><strong>de</strong>l</strong> total <strong>de</strong> <strong>la</strong> po-<br />
b<strong>la</strong>ción reunía ingresos por <strong>de</strong>bajo <strong>de</strong> <strong>la</strong> línea <strong>de</strong> indig<strong>en</strong>cia. En el primer cuatrimestre <strong><strong>de</strong>l</strong> año<br />
2002, <strong>la</strong> incid<strong>en</strong>cia <strong>de</strong> <strong>la</strong> pobreza y <strong>de</strong> <strong>la</strong> indig<strong>en</strong>cia <strong>en</strong> el Área Metropolitana <strong><strong>de</strong>l</strong> Gran Bu<strong>en</strong>os<br />
Aires -única región <strong><strong>de</strong>l</strong> país <strong>en</strong> <strong>la</strong> que es posible efectuar el seguimi<strong>en</strong>to <strong>de</strong> <strong>la</strong> serie histórica-<br />
había superado el valor máximo originario que correspondía al pico hiperinf<strong>la</strong>cionario <strong>de</strong><br />
1989.<br />
FIGURA 2.- INCIDENCIA DE LA POBREZA Y DE LA INDIGENCIA EN LA POBLACIÓN DEL AMBA-<br />
60<br />
50<br />
40<br />
30<br />
20<br />
10<br />
0<br />
-10%<br />
-5%<br />
45%<br />
40%<br />
35%<br />
30%<br />
25%<br />
20%<br />
15%<br />
10%<br />
5%<br />
0%<br />
32,2<br />
10,7<br />
1988<br />
1988-2002<br />
Fu<strong>en</strong>te: E<strong>la</strong>b. Área Sociológica IIS-UCA sobre datos <strong><strong>de</strong>l</strong> Informe Económico Año 10, número 36. Abril <strong>de</strong> 2001.<br />
Ministerio <strong>de</strong> Economía <strong>de</strong> <strong>la</strong> Nación e INDEC, 2002.<br />
47,3<br />
16,5<br />
1989<br />
33,7<br />
6,6<br />
1990<br />
-3,19%<br />
0,61%<br />
Oct 98-99<br />
21,5<br />
1991<br />
3 3,2<br />
17,8 16,8<br />
1992<br />
19,0<br />
4,4 3,5<br />
1993<br />
15,38%<br />
6,40%<br />
Oct 99-00<br />
1994<br />
24,8<br />
6,3<br />
1995<br />
20<br />
27,9<br />
26,0 25,9 26,7<br />
28,9<br />
7,5 6,4 6,9 6,7 7,7<br />
1996<br />
1997<br />
PLP PLI<br />
41,90% 40,62%<br />
16,33%<br />
Oct 00-01<br />
1998<br />
1999<br />
24,47%<br />
Oct 01-<br />
Mar 02<br />
2000<br />
35,4<br />
12,2<br />
2001<br />
49,7<br />
22,7<br />
2002<br />
var lp<br />
var li