plan estrategico institucional 2012 - 2016 alcalde - Municipalidad de ...
plan estrategico institucional 2012 - 2016 alcalde - Municipalidad de ...
plan estrategico institucional 2012 - 2016 alcalde - Municipalidad de ...

You also want an ePaper? Increase the reach of your titles
YUMPU automatically turns print PDFs into web optimized ePapers that Google loves.
PLAN ESTRATEGICO INSTITUCIONAL DE LA MUNICIPALIDAD DISTRITAL DE LA MOLINA <strong>2012</strong>-<strong>2016</strong><br />
Miraflores 6,205 2.6 118,256 8.5 19<br />
Ate 13,072 5.5 101,882 7.3 8<br />
La Victoria 22,073 9.3 90,888 6.5 4<br />
San Juan <strong>de</strong><br />
Lurigancho<br />
17,354 7.3 64,601 4.6 4<br />
Santiago <strong>de</strong> Surco 6,071 2.6 62,034 4.4 10<br />
La Molina 1,837 0.8 21,459 1.6 12<br />
FUENTE: Elaboración propia, datos INEI.<br />
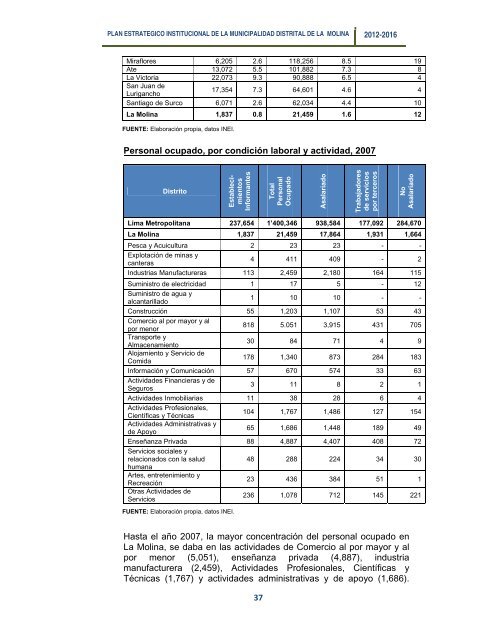
Personal ocupado, por condición laboral y actividad, 2007<br />
Distrito<br />
Establecimientos<br />
Informantes<br />
Total<br />
Personal<br />
Ocupado<br />
Asalariado<br />
Trabajadores<br />
<strong>de</strong> servicios<br />
por terceros<br />
No<br />
Asalariado<br />
Lima Metropolitana 237,654 1’400,346 938,584 177,092 284,670<br />
La Molina 1,837 21,459 17,864 1,931 1,664<br />
Pesca y Acuicultura 2 23 23 - -<br />
Explotación <strong>de</strong> minas y<br />
canteras<br />
4 411 409 - 2<br />
Industrias Manufactureras 113 2,459 2,180 164 115<br />
Suministro <strong>de</strong> electricidad 1 17 5 - 12<br />
Suministro <strong>de</strong> agua y<br />
alcantarillado<br />
1 10 10 - -<br />
Construcción 55 1,203 1,107 53 43<br />
Comercio al por mayor y al<br />
por menor<br />
818 5.051 3,915 431 705<br />
Transporte y<br />
Almacenamiento<br />
30 84 71 4 9<br />
Alojamiento y Servicio <strong>de</strong><br />
Comida<br />
178 1,340 873 284 183<br />
Información y Comunicación 57 670 574 33 63<br />
Activida<strong>de</strong>s Financieras y <strong>de</strong><br />
Seguros<br />
3 11 8 2 1<br />
Activida<strong>de</strong>s Inmobiliarias 11 38 28 6 4<br />
Activida<strong>de</strong>s Profesionales,<br />
Científicas y Técnicas<br />
104 1,767 1,486 127 154<br />
Activida<strong>de</strong>s Administrativas y<br />
<strong>de</strong> Apoyo<br />
65 1,686 1,448 189 49<br />
Enseñanza Privada 88 4,887 4,407 408 72<br />
Servicios sociales y<br />
relacionados con la salud<br />
48 288 224 34 30<br />
humana<br />
Artes, entretenimiento y<br />
Recreación<br />
23 436 384 51 1<br />
Otras Activida<strong>de</strong>s <strong>de</strong><br />
Servicios<br />
236 1,078 712 145 221<br />
FUENTE: Elaboración propia, datos INEI.<br />
Hasta el año 2007, la mayor concentración <strong>de</strong>l personal ocupado en<br />
La Molina, se daba en las activida<strong>de</strong>s <strong>de</strong> Comercio al por mayor y al<br />
por menor (5,051), enseñanza privada (4,887), industria<br />
manufacturera (2,459), Activida<strong>de</strong>s Profesionales, Científicas y<br />
Técnicas (1,767) y activida<strong>de</strong>s administrativas y <strong>de</strong> apoyo (1,686).<br />
37