quitumbe difusión y profundización de los resultados del estudio ...
quitumbe difusión y profundización de los resultados del estudio ...
quitumbe difusión y profundización de los resultados del estudio ...
You also want an ePaper? Increase the reach of your titles
YUMPU automatically turns print PDFs into web optimized ePapers that Google loves.
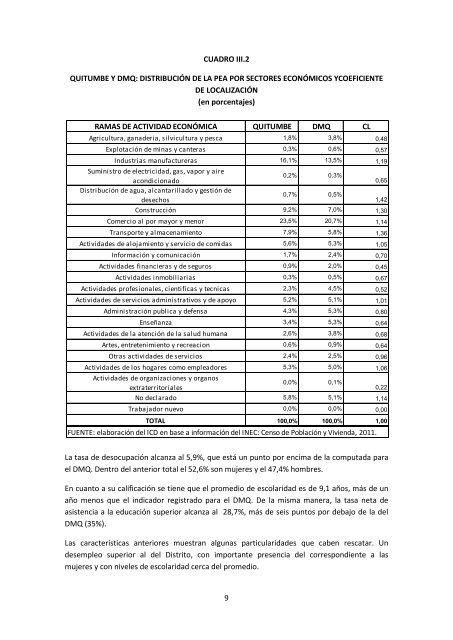
CUADRO III.2<br />
QUITUMBE Y DMQ: DISTRIBUCIÓN DE LA PEA POR SECTORES ECONÓMICOS YCOEFICIENTE<br />
DE LOCALIZACIÓN<br />
(en porcentajes)<br />
RAMAS DE ACTIVIDAD ECONÓMICA QUITUMBE DMQ CL<br />
Agricultura, gana<strong>de</strong>ria, silvicultura y pesca 1,8% 3,8% 0,48<br />
Explotación <strong>de</strong> minas y canteras 0,3% 0,6% 0,57<br />
Industrias manufactureras 16,1% 13,5% 1,19<br />
Suministro <strong>de</strong> electricidad, gas, vapor y aire<br />
0,2% 0,3%<br />
acondicionado<br />
0,65<br />
Distribución <strong>de</strong> agua, alcantarillado y gestión <strong>de</strong><br />
0,7% 0,5%<br />
<strong>de</strong>sechos<br />
1,42<br />
Construcción 9,2% 7,0% 1,30<br />
Comercio al por mayor y menor 23,5% 20,7% 1,14<br />
Transporte y almacenamiento 7,9% 5,8% 1,36<br />
Activida<strong>de</strong>s <strong>de</strong> alojamiento y servicio <strong>de</strong> comidas 5,6% 5,3% 1,05<br />
Información y comunicación 1,7% 2,4% 0,70<br />
Activida<strong>de</strong>s financieras y <strong>de</strong> seguros 0,9% 2,0% 0,45<br />
Activida<strong>de</strong>s inmobiliarias 0,3% 0,5% 0,67<br />
Activida<strong>de</strong>s profesionales, cientificas y tecnicas 2,3% 4,5% 0,52<br />
Activida<strong>de</strong>s <strong>de</strong> servicios administrativos y <strong>de</strong> apoyo 5,2% 5,1% 1,01<br />
Administración publica y <strong>de</strong>fensa 4,3% 5,3% 0,80<br />
Enseñanza 3,4% 5,3% 0,64<br />
Activida<strong>de</strong>s <strong>de</strong> la atención <strong>de</strong> la salud humana 2,6% 3,8% 0,68<br />
Artes, entretenimiento y recreacion 0,6% 0,9% 0,64<br />
Otras activida<strong>de</strong>s <strong>de</strong> servicios 2,4% 2,5% 0,96<br />
Activida<strong>de</strong>s <strong>de</strong> <strong>los</strong> hogares como empleadores 5,3% 5,0% 1,06<br />
Activida<strong>de</strong>s <strong>de</strong> organizaciones y organos<br />
0,0% 0,1%<br />
extraterritoriales<br />
0,22<br />
No <strong>de</strong>clarado 5,8% 5,1% 1,14<br />
Trabajador nuevo 0,0% 0,0% 0,00<br />
TOTAL 100,0% 100,0% 1,00<br />
FUENTE: elaboración <strong>de</strong>l ICD en base a información <strong>de</strong>l INEC: Censo <strong>de</strong> Población y Vivienda, 2011.<br />
La tasa <strong>de</strong> <strong>de</strong>socupación alcanza al 5,9%, que está un punto por encima <strong>de</strong> la computada para<br />
el DMQ. Dentro <strong>de</strong>l anterior total el 52,6% son mujeres y el 47,4% hombres.<br />
En cuanto a su calificación se tiene que el promedio <strong>de</strong> escolaridad es <strong>de</strong> 9,1 años, más <strong>de</strong> un<br />
año menos que el indicador registrado para el DMQ. De la misma manera, la tasa neta <strong>de</strong><br />
asistencia a la educación superior alcanza al 28,7%, más <strong>de</strong> seis puntos por <strong>de</strong>bajo <strong>de</strong> la <strong>de</strong>l<br />
DMQ (35%).<br />
Las características anteriores muestran algunas particularida<strong>de</strong>s que caben rescatar. Un<br />
<strong>de</strong>sempleo superior al <strong>de</strong>l Distrito, con importante presencia <strong>de</strong>l correspondiente a las<br />
mujeres y con niveles <strong>de</strong> escolaridad cerca <strong>de</strong>l promedio.<br />
9


