Descargar - Empresarios por la Educación
Descargar - Empresarios por la Educación
Descargar - Empresarios por la Educación
- No tags were found...

You also want an ePaper? Increase the reach of your titles
YUMPU automatically turns print PDFs into web optimized ePapers that Google loves.
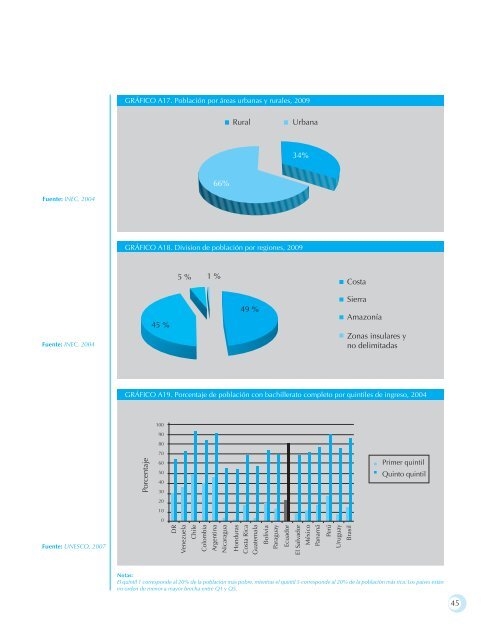
GRÁFICO A17. Pob<strong>la</strong>ción <strong>por</strong> áreas urbanas y rurales, 2009<br />
Rural<br />
Urbana<br />
34%<br />
66%<br />
Fuente: INEC, 2004<br />
GRÁFICO A18. Division de pob<strong>la</strong>ción <strong>por</strong> regiones, 2009<br />
5 %<br />
1 %<br />
Costa<br />
Fuente: INEC, 2004<br />
45 %<br />
49 %<br />
Sierra<br />
Amazonía<br />
Zonas insu<strong>la</strong>res y<br />
no delimitadas<br />
GRÁFICO A19. Porcentaje de pob<strong>la</strong>ción con bachillerato completo <strong>por</strong> quintiles de ingreso, 2004<br />
<br />
<br />
<br />
<br />
<br />
<br />
<br />
<br />
<br />
<br />
<br />
<br />
<br />
<br />
Fuente: UNESCO, 2007<br />
Notas:<br />
El quintil 1 corresponde al 20% de <strong>la</strong> pob<strong>la</strong>ción más pobre, mientras el quintil 5 corresponde al 20% de <strong>la</strong> pob<strong>la</strong>ción más rica. Los países están<br />
en orden de menor a mayor brecha entre Q1 y Q5.<br />
45