Desempleo en Chile y algunas propuestas para generar trabajo.
Desempleo en Chile y algunas propuestas para generar trabajo.
Desempleo en Chile y algunas propuestas para generar trabajo.

You also want an ePaper? Increase the reach of your titles
YUMPU automatically turns print PDFs into web optimized ePapers that Google loves.
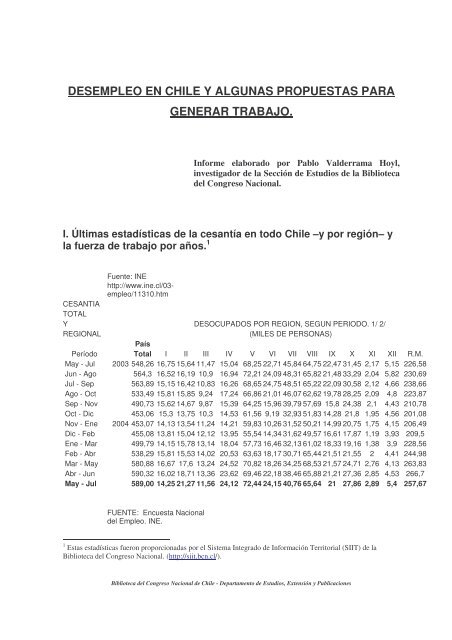
DESEMPLEO EN CHILE Y ALGUNAS PROPUESTAS PARAGENERAR TRABAJO.Informe elaborado por Pablo Valderrama Hoyl,investigador de la Sección de Estudios de la Bibliotecadel Congreso Nacional.I. Últimas estadísticas de la cesantía <strong>en</strong> todo <strong>Chile</strong> –y por región– yla fuerza de <strong>trabajo</strong> por años. 1Fu<strong>en</strong>te: INEhttp://www.ine.cl/03-empleo/11310.htmCESANTIATOTALY DESOCUPADOS POR REGION, SEGUN PERIODO. 1/ 2/REGIONAL(MILES DE PERSONAS)PaísPeríodo Total I II III IV V VI VII VIII IX X XI XII R.M.May - Jul 2003 548,26 16,75 15,64 11,47 15,04 68,25 22,71 45,84 64,75 22,47 31,45 2,17 5,15 226,58Jun - Ago 564,3 16,52 16,19 10,9 16,94 72,21 24,09 48,31 65,82 21,48 33,29 2,04 5,82 230,69Jul - Sep 563,89 15,15 16,42 10,83 16,26 68,65 24,75 48,51 65,22 22,09 30,58 2,12 4,66 238,66Ago - Oct 533,49 15,81 15,85 9,24 17,24 66,86 21,01 46,07 62,62 19,78 28,25 2,09 4,8 223,87Sep - Nov 490,73 15,62 14,67 9,87 15,39 64,25 15,96 39,79 57,69 15,8 24,38 2,1 4,43 210,78Oct - Dic 453,06 15,3 13,75 10,3 14,53 61,56 9,19 32,93 51,83 14,28 21,8 1,95 4,56 201,08Nov - Ene 2004 453,07 14,13 13,54 11,24 14,21 59,83 10,26 31,52 50,21 14,99 20,75 1,75 4,15 206,49Dic - Feb 455,08 13,81 15,04 12,12 13,95 55,54 14,34 31,62 49,57 16,61 17,87 1,19 3,93 209,5Ene - Mar 499,79 14,15 15,78 13,14 18,04 57,73 16,46 32,13 61,02 18,33 19,16 1,38 3,9 228,56Feb - Abr 538,29 15,81 15,53 14,02 20,53 63,63 18,17 30,71 65,44 21,51 21,55 2 4,41 244,98Mar - May 580,88 16,67 17,6 13,24 24,52 70,82 18,26 34,25 68,53 21,57 24,71 2,76 4,13 263,83Abr - Jun 590,32 16,02 18,71 13,36 23,62 69,46 22,18 38,46 65,88 21,21 27,36 2,85 4,53 266,7May - Jul 589,00 14,25 21,27 11,56 24,12 72,44 24,15 40,76 65,64 21 27,86 2,89 5,4 257,67FUENTE: Encuesta Nacionaldel Empleo. INE.1 Estas estadísticas fueron proporcionadas por el Sistema Integrado de Información Territorial (SIIT) de laBiblioteca del Congreso Nacional. (http://siit.bcn.cl/).Biblioteca del Congreso Nacional de <strong>Chile</strong> - Departam<strong>en</strong>to de Estudios, Ext<strong>en</strong>sión y Publicaciones