Análisis y Estrategia - Casa de Bolsa Banorte
Análisis y Estrategia - Casa de Bolsa Banorte
Análisis y Estrategia - Casa de Bolsa Banorte

You also want an ePaper? Increase the reach of your titles
YUMPU automatically turns print PDFs into web optimized ePapers that Google loves.
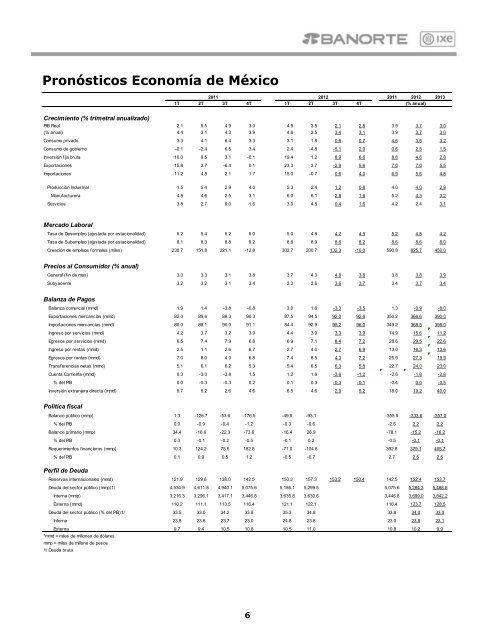
Pronósticos Economía <strong>de</strong> México2011 20121T 2T 3T 4T 1T 2T 3T 4T2011 2012 2013(% anual)Crecimiento (% trimetral anualizado)PIB Real 2.1 5.5 4.9 3.0 4.9 3.5 2.1 2.8 3.9 3.7 3.0(% anual) 4.4 3.1 4.3 3.9 4.6 3.5 3.4 3.1 3.9 3.7 3.0Consumo privado 3.3 4.1 6.4 3.3 3.1 1.8 0.6 0.7 4.6 3.6 3.2Consumo <strong>de</strong> gobierno -0.1 -2.4 6.5 3.4 2.4 -4.8 -5.1 2.0 0.6 2.5 1.5Inversión fija bruta 10.0 9.5 3.1 -0.1 19.4 1.2 8.9 6.6 8.8 4.6 2.8Exportaciones 15.8 3.7 -6.4 0.1 23.3 3.7 -2.9 5.6 7.0 7.0 5.5Importaciones 11.2 4.8 2.1 1.7 15.0 -0.7 0.6 4.0 6.9 5.6 4.8Producción Industrial 1.5 5.4 2.9 4.0 5.3 2.4 1.2 0.8 4.0 4.0 2.8Manufacturera 4.8 4.6 2.5 3.1 6.0 6.1 2.8 1.6 5.2 4.3 3.2Servicios 3.8 2.7 9.0 1.6 3.0 4.5 0.4 1.6 4.2 2.4 3.1Mercado LaboralTasa <strong>de</strong> Desempleo (ajustada por estacionalidad) 5.2 5.4 5.2 5.0 5.0 4.8 4.7 4.5 5.2 4.8 4.2Tasa <strong>de</strong> Subempleo (ajustada por estacionalidad) 8.1 8.3 8.8 9.2 8.6 8.9 8.6 8.2 8.6 8.6 8.0Creación <strong>de</strong> empleos formales (miles) 230.7 151.8 221.1 -12.8 302.7 200.7 132.3 -10.0 590.8 625.7 450.0Precios al Consumidor (% anual)General (fin <strong>de</strong> mes) 3.0 3.3 3.1 3.8 3.7 4.3 4.8 3.8 3.8 3.8 3.9Subyacente 3.2 3.2 3.1 3.4 3.3 3.6 3.6 3.7 3.4 3.7 3.4Balanza <strong>de</strong> PagosBalanza comercial (mmd) 1.9 1.4 -3.8 -0.8 3.0 1.6 -3.3 -3.5 1.3 -0.9 -8.0Exportaciones mercancías (mmd) 82.0 89.6 88.3 90.3 87.5 94.5 92.0 92.6 350.2 366.6 390.0Importaciones mercancías (mmd) 80.0 88.1 90.0 91.1 84.4 92.9 95.2 96.0 349.2 368.5 398.0Ingreso por servicios (mmd) 4.2 3.7 3.2 3.9 4.4 3.9 3.3 3.9 14.9 15.6 11.2Egresos por servicios (mmd) 6.5 7.4 7.9 6.8 6.9 7.1 8.4 7.2 28.6 29.5 22.6Ingreso por rentas (mmd) 2.5 1.1 2.6 6.7 2.7 4.0 2.7 6.9 13.0 16.3 13.6Egresos por rentas (mmd) 7.0 8.0 4.0 6.8 7.4 8.5 4.3 7.2 25.9 27.3 19.9Transferencias netas (mmd) 5.1 6.1 6.2 5.3 5.4 6.5 6.3 5.8 22.7 24.0 23.0Cuenta Corriente (mmd) 0.3 -3.0 -3.8 1.5 1.2 1.6 -3.6 -1.2 -2.6 -1.8 -2.8% <strong>de</strong>l PIB 0.0 -0.3 -0.3 0.2 0.1 0.3 -0.3 -0.1 -0.4 0.0 -0.5Inversión extranjera directa (mmd) 5.7 5.2 2.6 4.6 6.5 4.6 2.9 5.2 18.0 19.2 40.0Política fiscalBalance público (mmp) 1.3 -126.7 -53.6 -176.5 -49.5 -93.1 -355.5 -333.6 -357.0% <strong>de</strong>l PIB 0.0 -0.9 -0.4 -1.2 -0.3 -0.6 -2.5 2.2 2.2Balance primario (mmp) 34.4 -16.6 -22.3 -73.6 -16.4 26.9 -78.1 -15.2 -16.2% <strong>de</strong>l PIB 0.3 -0.1 -0.2 -0.5 -0.1 0.2 -0.5 -0.1 -0.1Requerimientos financieros (mmp) 10.3 124.2 75.5 182.8 -71.0 -104.8 392.8 379.1 405.7% <strong>de</strong>l PIB 0.1 0.9 0.5 1.2 -0.5 -0.7 2.7 2.5 2.5Perfil <strong>de</strong> DeudaReservas internacionales (mmd) 121.9 129.6 138.0 142.5 150.3 157.3 153.2 150.4 142.5 152.4 153.7Deuda <strong>de</strong>l sector público (mmp)1/ 4,534.9 4,611.8 4,940.1 5,075.6 5,186.1 5,299.5 5,075.6 5,284.3 5,488.8Interna (mmp) 3,216.3 3,296.1 3,417.1 3,446.8 3,635.8 3,630.6 3,446.8 3,699.0 3,842.2Externa (mmd) 110.2 111.1 113.5 116.4 121.1 122.1 116.4 123.7 128.5Deuda <strong>de</strong>l sector público (% <strong>de</strong>l PIB)1/ 33.5 33.0 34.2 33.8 35.3 34.8 33.8 34.0 33.0Interna 23.8 23.6 23.7 23.0 24.8 23.8 23.0 23.8 23.1Externa 9.7 9.4 10.5 10.8 10.5 11.0 10.8 10.2 9.9*mmd = miles <strong>de</strong> millones <strong>de</strong> dólaresmmp = miles <strong>de</strong> millone <strong>de</strong> pesos1/ Deuda bruta6