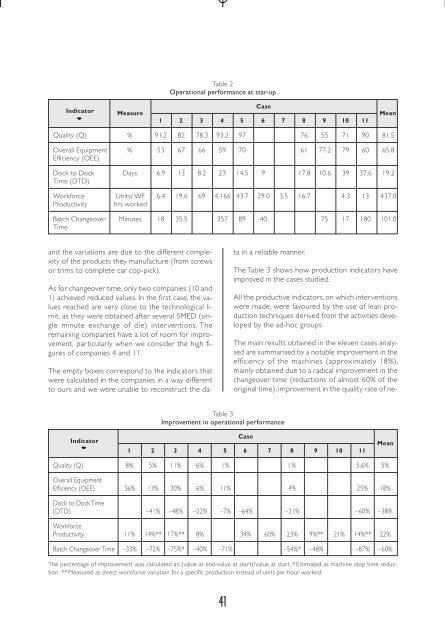
3.2. Measur<strong>es</strong>All the compani<strong>es</strong> received the same intervention,summarised in the four steps d<strong>es</strong>cribed above in thedata gathering proc<strong>es</strong>s.In order to create our dependent variabl<strong>es</strong>, we selectedonly production efficiency indicators gatheredby objective measur<strong>es</strong>. We considered that, for ther<strong>es</strong>earch aims proposed, objective performance measur<strong>es</strong>provide a more robust comparison, as theyare l<strong>es</strong>s prone to short-term fluctuations Lowe et al.(1997). As our inter<strong>es</strong>t was centred on evaluating theimpact on the production proc<strong>es</strong>s, no financial indicatorsor indicators of human r<strong>es</strong>ourc<strong>es</strong>-related aspectswere registered.The five operational measur<strong>es</strong> utilised to ass<strong>es</strong>s theefficiency of the productive proc<strong>es</strong>s were as follows:— Quality (Q) de Toni y Tonchia (1996), Giffi et al.(1990), Gunn (1992), Maskell (1995): percentageof correct piec<strong>es</strong>, compared with the totalnumber of piec<strong>es</strong> proc<strong>es</strong>sed.— Overall Equipment Efficiency (OEE): Dal et al.(2000), Giffi et al. (1990), Maskell (1995): time inwhich the machine is working according to specificationsproducing correct piec<strong>es</strong>, comparedwith the total net time available.— Dock to Dock Time (DTD): de Toni y Tonchia(1996), Giffi et al. (1990), Gunn (1992), Maskell(1995): average production time inv<strong>es</strong>ted in rawmaterials, work in proc<strong>es</strong>s and finished goods ofa product.— Workforce Productivity de Toni y Tonchia (1996),Giffi et al. (1990), Lowe et al. (1997): units producedper hour.— Changeover Time Giffi et al. (1990), Gunn (1992),Maskell (1995), Schonberger (1996): time that amachine is stopped to make the nec<strong>es</strong>sary adjustmentsso that it can manufacture a differentreference.The absolute valu<strong>es</strong> of th<strong>es</strong>e operational measur<strong>es</strong>can depend, among other factors, on the volume ofproduction of the company, the capacity used, thetype of proc<strong>es</strong>s, or differenc<strong>es</strong> due to the complexityof products or time required to make them Bankeret al. (1996), Cua et al. (2001), Ichniowski y Shaw(1999), Lowe et al. (1997). We should str<strong>es</strong>s that noneof th<strong>es</strong>e factors changed substantially in any of thecompani<strong>es</strong> during the observation period. To be ableto compare the degree of improvement between thedifferent compani<strong>es</strong> we selected as dependent variabl<strong>es</strong>of our r<strong>es</strong>earch the percentage that repr<strong>es</strong>entedthe improvement of the value of an indicatorover the initial situation, i. e:Value After – Value Before%Im provement=———————————— * 100[1]Value Before4. R<strong>es</strong>ultsBefore discussing the overall r<strong>es</strong>ults of the compani<strong>es</strong>analysed, we shall d<strong>es</strong>cribe the state of the compani<strong>es</strong>at the outset. We will begin by relating theproduction system in the different compani<strong>es</strong>, in orderto subsequently show the value of the operationalmeasur<strong>es</strong> in each of the compani<strong>es</strong> before initiatingthe intervention of Kaizen-Blitz teams.The production system in each plant was <strong>es</strong>tablishedon the basis of the data compiled during the interviewand visit to the production faciliti<strong>es</strong>. We consideredthat most of the compani<strong>es</strong> would either beat an initial early stage, which could be associated toa traditional point of view of mass production (cas<strong>es</strong>3 and 6), or else an initial stage in the developmentproc<strong>es</strong>s towards lean production (cas<strong>es</strong> 2, 4, 5, 7, 8,9 and 11). Company number 1 was at an intermediat<strong>es</strong>tage of development and only company 10 seemedto have advanced to any degree in the leanproduction implementation proc<strong>es</strong>s.Regarding the initial situation of the productive indicatorsof each of the compani<strong>es</strong> (Table 2), in the qualityindicator most of the compani<strong>es</strong> were below therecommended standards for world class manufacturingDal et al. (2000). The low<strong>es</strong>t were cas<strong>es</strong> 9 and10, due to the complexity of their proc<strong>es</strong>s<strong>es</strong>.As for OEE, only company 10 had a level close to80%, which may be considered a benchmark of worldclass manufacturing Dal et al. (2000), whereas theother compani<strong>es</strong> were below the thr<strong>es</strong>hold thatwould be considered acceptable (60%-75%).More than half of the compani<strong>es</strong> have a dock to dockof more than 10 manufacturing days, thanks to whichthey are able to offset possible inefficienci<strong>es</strong> of theirproduction lin<strong>es</strong>. Compani<strong>es</strong> 10, 11 and 4 had thehigh<strong>es</strong>t dock to dock rate.The workforce productivity is, apparently, acceptable40
Table 2Operational performance at star-upCaseIndicator Measure 1 2 3 4 5 6 7 8 9 10 11MeanQuality (Q) % 91.2 82 78.3 93.2 97 76 55 71 90 81.5Overall Equipment % 53 67 66 59 70 61 77.2 79 60 65.8Efficiency (OEE)Dock to Dock Days 6.9 13 8.2 23 14.5 9 17.8 10.6 39 37.6 19.2Time (DTD)Workforce Units/ WF 6.4 19.6 69 4,166 43.7 29.0 3.5 16.7 4.3 13 437.0Productivity hrs workedBatch Changeover Minut<strong>es</strong> 18 35.5 357 89 40 75 17 180 101.0Timeand the variations are due to the different complexityof the products they manufacture (from screwsor trims to complete car cop-pick).As for changeover time, only two compani<strong>es</strong> (10 and1) achieved reduced valu<strong>es</strong>. In the first case, the valu<strong>es</strong>reached are very close to the technological limit,as they were obtained after several SMED (singleminute exchange of die) interventions. Theremaining compani<strong>es</strong> have a lot of room for improvement,particularly when we consider the high figur<strong>es</strong>of compani<strong>es</strong> 4 and 11.The empty box<strong>es</strong> corr<strong>es</strong>pond to the indicators thatwere calculated in the compani<strong>es</strong> in a way differentto ours and we were unable to reconstruct the datain a reliable manner.The Table 3 shows how production indicators haveimproved in the cas<strong>es</strong> studied.All the productive indicators, on which interventionswere made, were favoured by the use of lean productiontechniqu<strong>es</strong> derived from the activiti<strong>es</strong> developedby the ad-hoc groupsThe main r<strong>es</strong>ults obtained in the eleven cas<strong>es</strong> analysedare summarised by a notable improvement in theefficiency of the machin<strong>es</strong> (approximately 18%),mainly obtained due to a radical improvement in thechangeover time (reductions of almost 60% of theoriginal time); improvement in the quality rate of ne-IndicatorTable 3Improvement in operational performanceCase1 2 3 4 5 6 7 8 9 10 11MeanQuality (Q) 8% 5% 11% 6% 1% 1% 5,6% 5%Overall EquipmentEfficiency (OEE) 36% 13% 30% 6% 11% 4% 25% 18%Dock to Dock Time(DTD) –41% –48% –22% –7% –64% –21% –60% –38%WorkforceProductivity 11% 14%** 17%** 8% 34% 60% 23% 9%** 21% 14%** 22%Batch Changeover Time –33% –72% –75%* –40% –71% –54%* –48% –87% –60%The percentage of improvement was calculated as: (value at end-value at start(/value at start. *Estimated as machine stop time reduction.**Measured as direct workforce variation for a specific production instead of units per hour worked.41
- Page 1: POLITÉCNICANÚMERO ESPECIALXI Cong
- Page 4 and 5: mayor difusión y visibilidad de la
- Page 7: Nº 35D-O1INTEGRACION DE UN SIG CON
- Page 10 and 11: Figura 3Estructura y principales co
- Page 12 and 13: Tabla 1Análisis VRP implementadosA
- Page 14 and 15: para casos concretos. Periódicamen
- Page 16 and 17: de determinar en qué municipio col
- Page 18 and 19: Tabla 3Definición de las variables
- Page 20 and 21: Figura 3Individuo (izda.) y método
- Page 22 and 23: los anteriores dada la dificultad d
- Page 24 and 25: — Si un puente-grúa llega antes
- Page 26 and 27: Una secuencia cíclica, definida po
- Page 28 and 29: Tabla 1Valores medios de tiempo de
- Page 30 and 31: D-O4LAS RELACIONES ENTRE LAS EMPRES
- Page 32 and 33: Además, el círculo social en el q
- Page 34 and 35: Tabla 3Resultados de la aplicación
- Page 36 and 37: entre empresas no reduzcan la compe
- Page 38 and 39: esources, such as training, teamwor
- Page 42 and 43: arly 5% (setting out from levels ov
- Page 44 and 45: industry International Journal of O
- Page 46 and 47: de vencimiento. De acuerdo con Koul
- Page 48 and 49: una definición única. A continuac
- Page 50 and 51: Tabla 3Tiempos medios, en segundos,
- Page 52 and 53: D-O7LEAN PRODUCTION IMPLEMENTATION:
- Page 54 and 55: 56 Egyptian LP implementers and 38
- Page 56 and 57: Figure 1Main strategic objetives (L
- Page 58 and 59: 80%70%60%50%40%30%20%10%0%Figure 4C
- Page 60 and 61: Another very interesting result is
- Page 62 and 63: se produzcan situaciones no deseabl
- Page 64 and 65: el trayecto HRST250, definido para
- Page 66 and 67: Sujeto a:Restricciones [1] [2]…[1
- Page 68 and 69: MOUDANI, W., y MORA-CAMINO, F. A dy
- Page 70 and 71: Papadimitriou and Kanellakis (1980)
- Page 72 and 73: which may result in a relatively be
- Page 74 and 75: fraction, see Figure 4b (crossover-
- Page 76 and 77: Table 4Solution for the semi dynami
- Page 78 and 79: 8. ReferencesAPT, K. (2003). Princi
- Page 80 and 81: jetivo es analizar el vínculo exis
- Page 82 and 83: Adicionalmente, una relación entre
- Page 84 and 85: Figura 2Relaciones presentes en la
- Page 86 and 87: Figura 4Valoración en la muestra d
- Page 88 and 89: Nº 35D-O11MATHEMATICAL PROGRAMMING
- Page 90 and 91:
3.4. ConstraintsThe following const
- Page 92 and 93:
a PC at 1.83 GHz with 1 GB of RAM m
- Page 94 and 95:
Table 2Time differences between tim
- Page 96 and 97:
D-O12PATENTALAVA. DINÁMICA DE LAS
- Page 98 and 99:
Figura 2Evolución de las solicitud
- Page 100 and 101:
Figura 5Clusters tecnológicos en e
- Page 102 and 103:
cia un cambio en lo que podíamos d
- Page 104 and 105:
Figura 1Esquema de tecnologías alt
- Page 106 and 107:
tre otros, el coste de arranque de
- Page 108 and 109:
5.2. Construcción de las cuentas d
- Page 110 and 111:
D-O14PLANIFICACIÓN DEL TIEMPO DE T
- Page 112 and 113:
4. ModeloAunque todos los trabajado
- Page 114 and 115:
[12] impone que si la variable cl t
- Page 116 and 117:
Nº 35D-O15TRANSFERENCIA TECNOLÓGI
- Page 118 and 119:
de robótica y producción. Por una
- Page 120 and 121:
ien la diferencia no aparece signif
- Page 122 and 123:
presas es la siguiente (todos con p
- Page 124 and 125:
SANTORO, M. D., y GOPALAKRISHNAN, S
- Page 126 and 127:
⎧ ⎪⎪⎪⎪⎨⎪⎪⎪⎪⎩
- Page 128 and 129:
Substituting in the previous expres
- Page 130 and 131:
8.0007.0006.0005.0004.0003.0002.000
- Page 132:
POLITÉCNICAPROGRAMAS MASTER• Adm