
Create successful ePaper yourself
Turn your PDF publications into a flip-book with our unique Google optimized e-Paper software.
<strong>LOGÍSTICA</strong> & <strong>TRANSPORTE</strong><br />
connections, in particular freight railway links, between ports<br />
in the Atlantic façade (e.g. Gijon) and in the Mediterranean<br />
coast (e.g. Valencia, Murcia), and the industrial production<br />
centres in the interior of the Iberian Peninsula. This would<br />
include a better use of the rail infrastructure for freight<br />
transport.<br />
Competition in port services to raise ports'<br />
efficiency and competitiveness<br />
Spanish ports play an important role for regional development<br />
purposes. A national long-term strategy for port development,<br />
establishing investment priorities for ports according to their<br />
role and function would help to ensure a better use of the<br />
extensive network of Spanish ports. In line with that strategy,<br />
ports should be able to adopt more efficient pricing policies,<br />
facilitating maritime trade options and ensuring long term<br />
recovery of infrastructural costs.<br />
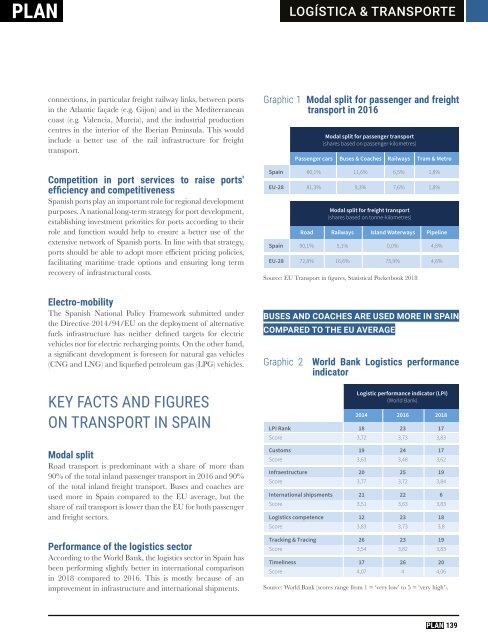
Graphic 1 Modal split for passenger and freight<br />
transport in 2016<br />
Modal split for passenger transport<br />
(shares based on passenger-kilometres)<br />
Passenger cars Buses & Coaches Railways Tram & Metro<br />
Spain 80,1% 11,6% 6,5% 1,8%<br />
EU-28 81,3% 9,3% 7,6% 1,8%<br />
Modal split for freight transport<br />
(shares based on tonne-kilometres)<br />
Road Railways Island Waterways Pipeline<br />
Spain 90,1% 5,1% 0,0% 4,8%<br />
EU-28 72,8% 16,6% 75,9% 4,6%<br />
Source: EU Transport in figures, Statistical Pocketbook 2018<br />
Electro-mobility<br />
The Spanish National Policy Framework submitted under<br />
the Directive 2014/94/EU on the deployment of alternative<br />
fuels infrastructure has neither defined targets for electric<br />
vehicles nor for electric recharging points. On the other hand,<br />
a significant development is foreseen for natural gas vehicles<br />
(CNG and LNG) and liquefied petroleum gas (LPG) vehicles.<br />
KEY FACTS AND FIGURES<br />
ON TRANSPORT IN SPAIN<br />
Modal split<br />
Road transport is predominant with a share of more than<br />
90% of the total inland passenger transport in 2016 and 90%<br />
of the total inland freight transport. Buses and coaches are<br />
used more in Spain compared to the EU average, but the<br />
share of rail transport is lower than the EU for both passenger<br />
and freight sectors.<br />
Performance of the logistics sector<br />
According to the World Bank, the logistics sector in Spain has<br />
been performing slightly better in international comparison<br />
in 2018 compared to 2016. This is mostly because of an<br />
improvement in infrastructure and international shipments.<br />
BUSES AND COACHES ARE USED MORE IN SPAIN<br />
COMPARED TO THE EU AVERAGE<br />
Graphic 2 World Bank Logistics performance<br />
indicator<br />
Logistic performance indicator (LPI)<br />
(World Bank)<br />
2014 2016 2018<br />
LPI Rank 18 23 17<br />
Score 3,72 3,73 3,83<br />
Customs 19 24 17<br />
Score 3,63 3,48 3,62<br />
Infraestructure 20 25 19<br />
Score 3,77 3,72 3,84<br />
International shipsments 21 22 6<br />
Score 3,51 3,63 3,83<br />
Logistics competence 12 23 18<br />
Score 3,83 3,73 3,8<br />
Tracking & Tracing 26 23 19<br />
Score 3,54 3,82 3,83<br />
Timeliness 17 26 20<br />
Score 4,07 4 4,06<br />
Source: World Bank (scores range from 1 = ‘very low’ to 5 = ‘very high’).<br />
139