
Create successful ePaper yourself
Turn your PDF publications into a flip-book with our unique Google optimized e-Paper software.
<strong>LOGÍSTICA</strong> & <strong>TRANSPORTE</strong><br />
Graphic 6 Consumer satisfaction<br />
80<br />
70<br />
60<br />
50<br />
40<br />
30<br />
20<br />
10<br />
0<br />
Spain<br />
Rail transport<br />
EU-28<br />
Spain<br />
2013 2015 2017<br />
Urban transport<br />
EU-28<br />
Source: DG JUST Consumer Markets Scoreboard (composite index from<br />
0 = ‘low performance to 100 = ‘high performance’).<br />
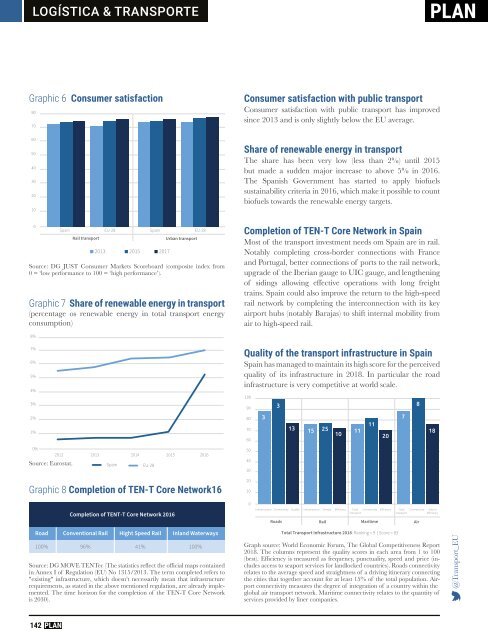
Graphic 7 Share of renewable energy in transport<br />
(percentage os renewable energy in total transport energy<br />
consumption)<br />
Consumer satisfaction with public transport<br />
Consumer satisfaction with public transport has improved<br />
since 2013 and is only slightly below the EU average.<br />
Share of renewable energy in transport<br />
The share has been very low (less than 2%) until 2015<br />
but made a sudden major increase to above 5% in 2016.<br />
The Spanish Government has started to apply biofuels<br />
sustainability criteria in 2016, which make it possible to count<br />
biofuels towards the renewable energy targets.<br />
Completion of TEN-T Core Network in Spain<br />
Most of the transport investment needs om Spain are in rail.<br />
Notably completing cross-border connections with France<br />
and Portugal, better connections of ports to the rail network,<br />
upgrade of the Iberian gauge to UIC gauge, and lengthening<br />
of sidings allowing effective operations with long freight<br />
trains. Spain could also improve the return to the high-speed<br />
rail network by completing the interconnection with its key<br />
airport hubs (notably Barajas) to shift internal mobility from<br />
air to high-speed rail.<br />
8%<br />
7%<br />
6%<br />
5%<br />
4%<br />
3%<br />
2%<br />
1%<br />
Quality of the transport infrastructure in Spain<br />
Spain has managed to maintain its high score for the perceived<br />
quality of its infrastructure in 2018. In particular the road<br />
infrastructure is very competitive at world scale.<br />
100<br />
90<br />
80<br />
70<br />
60<br />
3<br />
3<br />
13 15 25<br />
10<br />
11<br />
11<br />
20<br />
7<br />
8<br />
18<br />
0%<br />
2012 2013<br />
Source: Eurostat.<br />
Spain<br />
2014 2015 2016<br />
EU-28<br />
50<br />
40<br />
30<br />
Graphic 8 Completion of TEN-T Core Network16<br />
Completion of TENT-T Core Network 2016<br />
20<br />
10<br />
0<br />
Infrastructure Connectivity Quality Infrastructure Density Efficiency Total Connectivity Efficiency Total Connectivity Airport<br />
transport<br />
transport<br />
Efficiency<br />
Roads Rail Maritime Air<br />
Road Conventional Rail Hight Speed Rail Inland Waterways<br />
100% 96% 41% 100%<br />
Source: DG MOVE TENTec (The statistics reflect the official maps contained<br />
in Annex I of Regulation (EU) No 1315/2013. The term completed refers to<br />
"existing" infrastructure, which doesn’t necessarily mean that infrastructure<br />
requirements, as stated in the above mentioned regulation, are already implemented.<br />
The time horizon for the completion of the TEN-T Core Network<br />
is 2030).<br />
Total Transport Infrastructure 2018: Ranking = 9 | Score = 83<br />
Graph source: World Economic Forum, The Global Competitiveness Report<br />
2018. The columns represent the quality scores in each area from 1 to 100<br />
(best). Efficiency is measured as frequency, punctuality, speed and price (includes<br />
access to seaport services for landlocked countries). Roads connectivity<br />
relates to the average speed and straightness of a driving itinerary connecting<br />
the cities that together account for at least 15% of the total population. Airport<br />
connectivity measures the degree of integration of a country within the<br />
global air transport network. Maritime connectivity relates to the quantity of<br />
services provided by liner companies.<br />
@Transport_EU<br />
142