Popu<strong>la</strong>tion (milliers) 2002 moins de moins de 18 ans 5 ans Taux annuel d’accroissement démographique (%) 1970-90 1990-2002 Taux brut de mortalité 1970 2002 Taux brut de natalité 1970 2002 …TABLEAU 6 Estonie 288 58 0,7 -1,4 11 14 15 9 70 72 1,2 69 1,2 -1,6 Etats-Unis 75441 20612 1,0 1,1 9 8 17 15 71 77 2,1 78 1,1 1,3 Ethiopie 36134 12235 2,6 2,9 23 18 49 43 41 46 6,2 16 4,6 4,9 Fidji 322 96 1,6 1,2 8 6 34 24 60 70 2,9 51 2,5 2,8 Fin<strong>la</strong>nde 1119 286 0,4 0,3 10 10 14 11 70 78 1,7 59 1,4 0,0 France 13500 3763 0,6 0,4 11 9 17 13 72 79 1,9 76 0,8 0,6 Gabon 623 190 2,9 2,6 21 12 35 32 47 57 4,0 83 6,9 4,3 Gambie 654 218 3,5 3,3 28 13 50 36 36 54 4,8 32 6,0 5,4 Géorgie 1247 278 0,7 -0,4 9 10 19 10 68 74 1,4 57 1,5 -0,2 Ghana 9679 2937 2,9 2,4 17 10 48 32 49 58 4,2 37 3,6 3,2 Grèce 1996 512 0,7 0,6 8 10 17 9 72 78 1,3 61 1,3 0,9 Grenade 28 8 -0,4 -0,5 - - - - - - - 39 -0,1 0,6 Guatema<strong>la</strong> 6005 1909 2,6 2,7 15 7 45 35 52 66 4,5 40 2,9 3,1 Guinée 4235 1467 2,3 2,6 28 16 51 43 37 49 5,9 28 4,9 4,2 Guinée-Bissau 774 283 2,8 3,0 29 20 49 50 36 45 7,1 33 5,0 5,8 Guinée équatoria<strong>le</strong> 241 84 0,9 2,6 23 17 39 43 40 49 5,9 51 2,4 5,4 Guyana 274 80 0,2 0,4 11 9 38 22 60 63 2,3 37 0,8 1,3 Haïti 3854 1120 2,1 1,4 19 15 39 30 47 49 4,0 37 4,1 3,3 Honduras 3223 976 3,2 2,8 15 6 49 30 52 69 3,8 55 5,0 5,0 Hongrie 1989 464 0,0 -0,4 11 14 15 9 69 72 1,2 65 1,2 0,0 I<strong>le</strong>s Cook 8 2 -0,6 0,0 - - - - - - - 59 -0,2 0,2 I<strong>le</strong>s Marshall 22 6 3,7 1,4 - - - - - - - 66 3,8 1,6 I<strong>le</strong>s Salomon 230 74 3,4 3,1 10 5 46 34 54 69 4,5 21 5,9 6,1 Inde 413623 119524 2,1 1,8 17 9 40 24 49 64 3,1 28 3,4 2,6 Indonésie 78108 21672 2,1 1,5 17 7 41 21 48 67 2,4 43 5,0 4,3 Iran (République is<strong>la</strong>mique d’) 27823 5989 3,4 1,5 14 5 43 20 54 70 2,4 65 4,9 2,8 Iraq 11804 3766 3,1 2,9 16 9 49 35 55 60 4,8 68 4,2 2,6 Ir<strong>la</strong>nde 1009 271 0,9 0,9 11 8 22 14 71 77 1,9 60 1,3 1,3 Is<strong>la</strong>nde 79 21 1,1 1,0 7 7 21 14 74 80 2,0 93 1,4 1,2 Israël 2082 628 2,2 2,8 7 6 27 20 71 79 2,7 92 2,6 2,9 Italie 9845 2590 0,3 0,1 10 11 17 9 72 79 1,2 67 0,4 0,2 Jamahiriya arabe libyenne 2111 588 3,9 2,0 16 4 50 23 52 73 3,1 88 6,8 2,6 Jamaïque 971 264 1,2 0,9 8 6 35 21 68 76 2,4 57 2,3 1,7 Japon 22406 6001 0,8 0,3 7 8 19 9 72 81 1,3 79 1,3 0,4 Jordanie 2375 728 3,5 4,1 16 4 50 28 54 71 3,6 79 4,7 4,9 Kazakhstan 4974 1151 1,2 -0,7 9 10 26 16 64 66 2,0 56 1,9 -0,9 Kenya 15771 4630 3,6 2,4 17 17 52 33 50 45 4,1 35 7,9 5,7 Kirghizistan 1986 525 2,0 1,2 11 7 31 22 62 68 2,7 34 2,0 0,4 Kiribati 36 11 1,9 1,6 - - - - - - - 39 3,4 2,6 Koweït 743 242 5,3 1,1 6 2 47 20 66 76 2,7 96 6,3 1,2 Lesotho 860 245 2,1 1,1 17 25 42 31 49 36 3,9 30 6,4 4,4 L<strong>et</strong>tonie 497 91 0,7 -1,3 11 14 14 8 70 71 1,1 60 1,3 -2,5 l’ex-République yougos<strong>la</strong>ve de Macédoine 548 144 1,0 0,6 8 8 24 15 66 74 1,9 60 2,0 0,8 Liban 1280 335 0,5 2,4 11 5 35 19 64 73 2,2 90 2,2 2,9 Libéria 1732 617 2,2 3,5 22 21 50 50 42 41 6,8 46 4,6 4,3 Liechtenstein 7 2 1,6 1,2 - - - - - - - 22 1,7 1,7 Lituanie 828 177 0,9 -0,6 9 12 17 9 71 73 1,3 69 2,4 -0,5 Luxembourg 100 28 0,5 1,4 12 8 13 13 70 78 1,7 92 1,7 2,0 Madagascar 8638 2996 2,7 2,9 21 13 46 42 44 53 5,7 31 5,3 5,1 Ma<strong>la</strong>isie 9344 2720 2,5 2,5 10 5 37 23 61 73 2,9 59 4,5 3,8 Ma<strong>la</strong>wi 6232 2234 3,7 1,9 24 24 56 45 40 38 6,1 16 7,0 4,3 Maldives 155 50 2,9 3,0 17 6 40 36 50 67 5,4 29 6,1 3,8 Mali 7099 2500 2,4 2,8 26 16 52 50 38 49 7,0 32 4,9 5,2 Malte 93 23 0,9 0,7 9 8 17 12 70 78 1,8 91 1,5 1,1 Maroc 11517 3254 2,4 1,7 17 6 47 23 52 68 2,8 57 4,0 3,0 Maurice 363 98 1,2 1,1 7 7 28 16 62 72 2,0 42 1,0 1,4 Mauritanie 1390 485 2,4 2,7 21 14 46 42 42 52 5,8 61 8,2 5,4 Espérance de vie 1970 2002 Indice synthétique de fécondité 2002 % de<strong>la</strong> popu<strong>la</strong>tion urbanisée 2002 LA SITUATION DES ENFANTS DANS LE MONDE <strong>2004</strong> Taux annuel moyen d’accroissement de <strong>la</strong> popu<strong>la</strong>tion urbaine (%) 1970-90 1990-2002 123
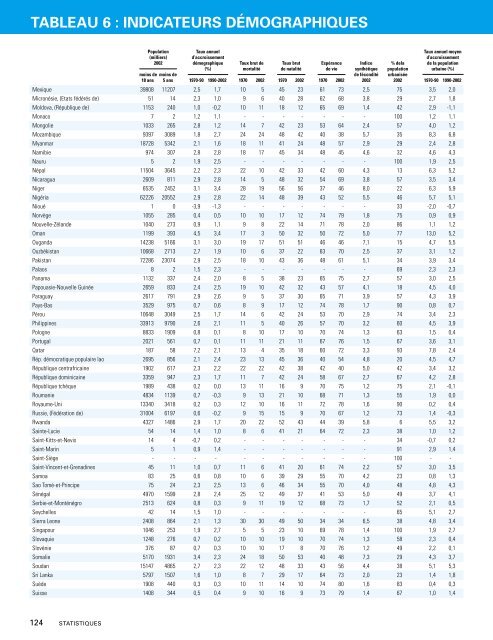
TABLEAU 6 : INDICATEURS DÉMOGRAPHIQUES Mexique 39808 11207 2,5 1,7 10 5 45 23 61 73 2,5 75 3,5 2,0 Micronésie, (Etats fédérés de) 51 14 2,3 1,0 9 6 40 28 62 68 3,8 29 2,7 1,8 Moldova, (République de) 1153 240 1,0 -0,2 10 11 18 12 65 69 1,4 42 2,9 -1,1 Monaco 7 2 1,2 1,1 - - - - - - - 100 1,2 1,1 Mongolie 1033 265 2,8 1,2 14 7 42 23 53 64 2,4 57 4,0 1,2 Mozambique 9397 3089 1,8 2,7 24 24 48 42 40 38 5,7 35 8,3 6,8 Myanmar 18728 5342 2,1 1,6 18 11 41 24 48 57 2,9 29 2,4 2,8 Namibie 974 307 2,8 2,8 18 17 45 34 48 45 4,6 32 4,6 4,3 Nauru 5 2 1,9 2,5 - - - - - - - 100 1,9 2,5 Népal 11504 3645 2,2 2,3 22 10 42 33 42 60 4,3 13 6,3 5,2 Nicaragua 2609 811 2,9 2,8 14 5 48 32 54 69 3,8 57 3,5 3,4 Niger 6535 2452 3,1 3,4 28 19 56 56 37 46 8,0 22 6,3 5,9 Nigéria 62226 20552 2,9 2,8 22 14 48 39 43 52 5,5 46 5,7 5,1 Nioué 1 0 -3,9 -1,3 - - - - - - - 33 -2,0 -0,7 Norvège 1055 285 0,4 0,5 10 10 17 12 74 79 1,8 75 0,9 0,9 Nouvel<strong>le</strong>-Zé<strong>la</strong>nde 1040 273 0,9 1,1 9 8 22 14 71 78 2,0 86 1,1 1,2 Oman 1199 393 4,5 3,4 17 3 50 32 50 72 5,0 77 13,0 5,2 Ouganda 14238 5166 3,1 3,0 19 17 51 51 46 46 7,1 15 4,7 5,5 Ouzbékistan 10668 2713 2,7 1,9 10 6 37 22 63 70 2,5 37 3,1 1,2 Pakistan 72286 23074 2,9 2,5 18 10 43 36 48 61 5,1 34 3,9 3,4 Pa<strong>la</strong>os 8 2 1,5 2,3 - - - - - - - 69 2,3 2,3 Panama 1132 337 2,4 2,0 8 5 38 23 65 75 2,7 57 3,0 2,5 Papouasie-Nouvel<strong>le</strong> Guinée 2659 833 2,4 2,5 19 10 42 32 43 57 4,1 18 4,5 4,0 Paraguay 2617 791 2,9 2,6 9 5 37 30 65 71 3,9 57 4,3 3,9 Pays-Bas 3529 975 0,7 0,6 8 9 17 12 74 78 1,7 90 0,8 0,7 Pérou 10648 3049 2,5 1,7 14 6 42 24 53 70 2,9 74 3,4 2,3 Philippines 33913 9790 2,6 2,1 11 5 40 26 57 70 3,2 60 4,5 3,9 Pologne 8833 1909 0,8 0,1 8 10 17 10 70 74 1,3 63 1,5 0,4 Portugal 2021 561 0,7 0,1 11 11 21 11 67 76 1,5 67 3,6 3,1 Qatar 187 58 7,2 2,1 13 4 35 18 60 72 3,3 93 7,8 2,4 Rép. démocratique popu<strong>la</strong>ire <strong>la</strong>o 2695 856 2,1 2,4 23 13 45 36 40 54 4,8 20 4,5 4,7 République centrafricaine 1902 617 2,3 2,2 22 22 42 38 42 40 5,0 42 3,4 3,2 République dominicaine 3359 947 2,3 1,7 11 7 42 24 58 67 2,7 67 4,2 2,8 République tchèque 1989 438 0,2 0,0 13 11 16 9 70 75 1,2 75 2,1 -0,1 Roumanie 4834 1139 0,7 -0,3 9 13 21 10 68 71 1,3 55 1,9 0,0 Royaume-Uni 13340 3418 0,2 0,3 12 10 16 11 72 78 1,6 90 0,2 0,4 Russie, (Fédération de) 31004 6197 0,6 -0,2 9 15 15 9 70 67 1,2 73 1,4 -0,3 Rwanda 4327 1486 2,9 1,7 20 22 52 43 44 39 5,8 6 5,5 3,2 Sainte-Lucie 54 14 1,4 1,0 8 6 41 21 64 72 2,3 38 1,0 1,2 Saint-Kitts-<strong>et</strong>-Nevis 14 4 -0,7 0,2 - - - - - - - 34 -0,7 0,2 Saint-Marin 5 1 0,9 1,4 - - - - - - - 91 2,9 1,4 Saint-Siège - - - - - - - - - - - 100 - - Saint-Vincent-<strong>et</strong>-Grenadines 45 11 1,0 0,7 11 6 41 20 61 74 2,2 57 3,0 3,5 Samoa 83 25 0,6 0,8 10 6 39 29 55 70 4,2 23 0,8 1,3 Sao Tomé-<strong>et</strong>-Principe 75 24 2,3 2,5 13 6 46 34 55 70 4,0 48 4,8 4,3 Sénégal 4970 1599 2,8 2,4 25 12 49 37 41 53 5,0 49 3,7 4,1 Serbie-<strong>et</strong>-Monténégro 2513 624 0,8 0,3 9 11 19 12 68 73 1,7 52 2,1 0,5 Seychel<strong>le</strong>s 42 14 1,5 1,0 - - - - - - - 65 5,1 2,7 Sierra Leone 2408 864 2,1 1,3 30 30 49 50 34 34 6,5 38 4,8 3,4 Singapour 1046 253 1,9 2,7 5 5 23 10 69 78 1,4 100 1,9 2,7 Slovaquie 1248 276 0,7 0,2 10 10 19 10 70 74 1,3 58 2,3 0,4 Slovénie 376 87 0,7 0,3 10 10 17 8 70 76 1,2 49 2,2 0,1 Somalie 5170 1931 3,4 2,3 24 18 50 53 40 48 7,3 29 4,3 3,7 Soudan 15147 4865 2,7 2,3 22 12 48 33 43 56 4,4 38 5,1 5,3 Sri Lanka 5797 1507 1,6 1,0 8 7 29 17 64 73 2,0 23 1,4 1,8 Suède 1908 440 0,3 0,3 10 11 14 10 74 80 1,6 83 0,4 0,3 Suisse 1408 344 0,5 0,4 9 10 16 9 73 79 1,4 67 1,0 1,4 124 STATISTIQUES Popu<strong>la</strong>tion (milliers) 2002 moins de moins de 18 ans 5 ans Taux annuel d’accroissement démographique (%) 1970-90 1990-2002 Taux brut de mortalité 1970 2002 Taux brut de natalité 1970 2002 Espérance de vie 1970 2002 Indice synthétique de fécondité 2002 % de<strong>la</strong> popu<strong>la</strong>tion urbanisée 2002 Taux annuel moyen d’accroissement de <strong>la</strong> popu<strong>la</strong>tion urbaine (%) 1970-90 1990-2002
- Page 1 and 2:
LA SITUATION DES ENFANTS DANS LE MO
- Page 3 and 4:
Remerciements Ce rapport a été pr
- Page 5 and 6:
TABLE DES MATIÈRES Encadrés Repè
- Page 7 and 8:
« …l’éducation des filles est
- Page 9 and 10:
1 RELANCER LE DÉVELOPPEMENT
- Page 11 and 12:
Non que cette situation soit inélu
- Page 13 and 14:
La date de réalisation de l’obje
- Page 15 and 16:
FIGURE 1 OBJECTIFS DE DÉVELOPPEMEN
- Page 17 and 18:
Mais si les portes de l’école de
- Page 19 and 20:
cation des filles est souvent laiss
- Page 21 and 22:
Une offensive concertée au niveau
- Page 23 and 24:
14 RELANCER LE DÉVELOPPEMENT
- Page 25 and 26:
2 DES FILLES INSTRUITES, UNE FORCE
- Page 27 and 28:
Grâce aux succès obtenus par leur
- Page 29 and 30:
par une meilleure connaissance des
- Page 31 and 32:
humain peut stimuler la croissance
- Page 33 and 34:
ou familial avaient été levés. E
- Page 35 and 36:
en développement 31 a conclu que q
- Page 37 and 38:
28 DES FILLES INSTRUITES, UNE FORCE
- Page 39 and 40:
3 FILLES EXCLUES, PAYS DISTANCÉS
- Page 41 and 42:
vérité régionale encore plus ala
- Page 43 and 44:
sexes en matière d’inscription d
- Page 45 and 46:
FIGURE 8 PARTICIPATION DES FILLES
- Page 47 and 48:
sés et les institutions financièr
- Page 49 and 50:
FIGURE 10 DÉPENSES GOUVERNEMENTALE
- Page 51 and 52:
42 FILLES EXCLUES, PAYS DISTANCÉS
- Page 53 and 54:
4 L’EFFET MULTIPLICATEUR DE L’
- Page 55 and 56:
d’être autonome, si elle est en
- Page 57 and 58:
Lutter contre le VIH/SIDA Chaque an
- Page 59 and 60:
Les filles sont encore plus pénali
- Page 61 and 62:
Aider les enfants dans les situatio
- Page 63 and 64:
Les avantages pour les communautés
- Page 65 and 66:
56 L’EFFET MULTIPLICATEUR DE L’
- Page 67 and 68:
5 ET LES GARÇONS ?
- Page 69 and 70:
mais il doit aboutir à un enseigne
- Page 71 and 72:
avaient abandonné leurs études, c
- Page 73 and 74:
dant la petite enfance et contribue
- Page 75 and 76:
On a alors modifié le module de fo
- Page 77 and 78:
68 ET LES GARÇONS ?
- Page 79 and 80:
6 LA MEILLEURE CHOSE À FAIRE
- Page 81 and 82: Dans le domaine de l’éducation d
- Page 83 and 84: Pour le ministre du plan, qui doit
- Page 85 and 86: 4. Ne pas cantonner la réflexion a
- Page 87 and 88: comité scolaire peut être le poin
- Page 89 and 90: 80 LA MEILLEURE CHOSE À FAIRE
- Page 92 and 93: © UNICEF/HQ03-0254/Shehzad Noorani
- Page 94 and 95: Assouplir l’enseignement. Les enf
- Page 96 and 97: enseignant plus faible que dans les
- Page 98: gestion des écoles. Elle comporte
- Page 101 and 102: Les droits de l’homme sont indivi
- Page 103 and 104: RÉFÉRENCES 1. Organisation des Na
- Page 105 and 106: 60. Moya, Cecilia, ‘Life Skills A
- Page 108 and 109: STATISTIQUES Statistiques économiq
- Page 110 and 111: Classement des pays et territoires
- Page 112 and 113: Classement selon le TMM5 Taux de mo
- Page 114 and 115: …TABLEAU 1 Syrie, (République ar
- Page 116 and 117: % de nouveau-nés présentant une i
- Page 118 and 119: …TABLEAU 2 Territoire palestinien
- Page 120 and 121: % de la population utilisant des so
- Page 122 and 123: …TABLEAU 3 Syrie, (République ar
- Page 124 and 125: Taux de prévalence chez les adulte
- Page 126 and 127: …TABLEAU 4 Territoire palestinien
- Page 128 and 129: Nombres pour Taux net de fréquenta
- Page 130 and 131: …TABLEAU 5 Syrie, (République ar
- Page 134 and 135: …TABLEAU 6 Suriname 163 47 0,4 0,
- Page 136 and 137: RNB par habitant ($EU) 2002 Taux an
- Page 138 and 139: …TABLEAU 7 Territoire palestinien
- Page 140 and 141: Espérance de vie des femmes en % d
- Page 142 and 143: …TABLEAU 8 Territoire palestinien
- Page 144 and 145: …TABLEAU 9 Sierra Leone 57 57 57
- Page 146 and 147: Mesurer le développement humain :
- Page 148 and 149: Classement selon le TMM5 Taux de mo
- Page 150 and 151: …TABLEAU 10 Syrie, (République a
- Page 152 and 153: Départment of international develo
- Page 154 and 155: Jordanie, 13 Projet d’autonomisat
- Page 156 and 157: GLOSSAIRE ACDI : Agence canadienne