Etude préparatoire à la mise en oeuvre d'un système de consigne ...
Etude préparatoire à la mise en oeuvre d'un système de consigne ...
Etude préparatoire à la mise en oeuvre d'un système de consigne ...
You also want an ePaper? Increase the reach of your titles
YUMPU automatically turns print PDFs into web optimized ePapers that Google loves.
Réalisation d’une étu<strong>de</strong> préparatoire à <strong>la</strong> <strong>mise</strong> <strong>en</strong> œuvre d’un système <strong>de</strong><br />
<strong>consigne</strong> sur les canettes <strong>de</strong> boisson<br />
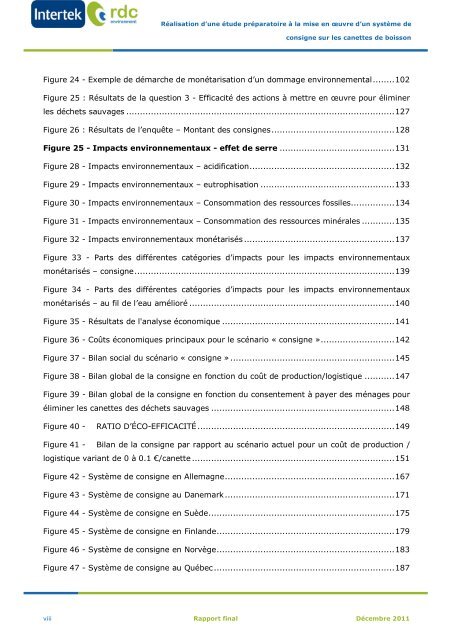
Figure 24 - Exemple <strong>de</strong> démarche <strong>de</strong> monétarisation d’un dommage <strong>en</strong>vironnem<strong>en</strong>tal ........ 102<br />
Figure 25 : Résultats <strong>de</strong> <strong>la</strong> question 3 - Efficacité <strong>de</strong>s actions à mettre <strong>en</strong> œuvre pour éliminer<br />
les déchets sauvages .................................................................................................. 127<br />
Figure 26 : Résultats <strong>de</strong> l’<strong>en</strong>quête – Montant <strong>de</strong>s <strong>consigne</strong>s ............................................. 128<br />
Figure 25 - Impacts <strong>en</strong>vironnem<strong>en</strong>taux - effet <strong>de</strong> serre .......................................... 131<br />
Figure 28 - Impacts <strong>en</strong>vironnem<strong>en</strong>taux – acidification ..................................................... 132<br />
Figure 29 - Impacts <strong>en</strong>vironnem<strong>en</strong>taux – eutrophisation ................................................. 133<br />
Figure 30 - Impacts <strong>en</strong>vironnem<strong>en</strong>taux – Consommation <strong>de</strong>s ressources fossiles ................ 134<br />
Figure 31 - Impacts <strong>en</strong>vironnem<strong>en</strong>taux – Consommation <strong>de</strong>s ressources minérales ............ 135<br />
Figure 32 - Impacts <strong>en</strong>vironnem<strong>en</strong>taux monétarisés ....................................................... 137<br />
Figure 33 - Parts <strong>de</strong>s différ<strong>en</strong>tes catégories d’impacts pour les impacts <strong>en</strong>vironnem<strong>en</strong>taux<br />
monétarisés – <strong>consigne</strong> ............................................................................................... 139<br />
Figure 34 - Parts <strong>de</strong>s différ<strong>en</strong>tes catégories d’impacts pour les impacts <strong>en</strong>vironnem<strong>en</strong>taux<br />
monétarisés – au fil <strong>de</strong> l’eau amélioré ........................................................................... 140<br />
Figure 35 - Résultats <strong>de</strong> l'analyse économique ............................................................... 141<br />
Figure 36 - Coûts économiques principaux pour le scénario « <strong>consigne</strong> »........................... 142<br />
Figure 37 - Bi<strong>la</strong>n social du scénario « <strong>consigne</strong> » ............................................................ 145<br />
Figure 38 - Bi<strong>la</strong>n global <strong>de</strong> <strong>la</strong> <strong>consigne</strong> <strong>en</strong> fonction du coût <strong>de</strong> production/logistique ........... 147<br />
Figure 39 - Bi<strong>la</strong>n global <strong>de</strong> <strong>la</strong> <strong>consigne</strong> <strong>en</strong> fonction du cons<strong>en</strong>tem<strong>en</strong>t à payer <strong>de</strong>s ménages pour<br />
éliminer les canettes <strong>de</strong>s déchets sauvages ................................................................... 148<br />
Figure 40 - RATIO D’ÉCO-EFFICACITÉ ........................................................................ 149<br />
Figure 41 - Bi<strong>la</strong>n <strong>de</strong> <strong>la</strong> <strong>consigne</strong> par rapport au scénario actuel pour un coût <strong>de</strong> production /<br />
logistique variant <strong>de</strong> 0 à 0.1 €/canette .......................................................................... 151<br />
Figure 42 - Système <strong>de</strong> <strong>consigne</strong> <strong>en</strong> Allemagne .............................................................. 167<br />
Figure 43 - Système <strong>de</strong> <strong>consigne</strong> au Danemark .............................................................. 171<br />
Figure 44 - Système <strong>de</strong> <strong>consigne</strong> <strong>en</strong> Suè<strong>de</strong> .................................................................... 175<br />
Figure 45 - Système <strong>de</strong> <strong>consigne</strong> <strong>en</strong> Fin<strong>la</strong>n<strong>de</strong> ................................................................. 179<br />
Figure 46 - Système <strong>de</strong> <strong>consigne</strong> <strong>en</strong> Norvège ................................................................. 183<br />
Figure 47 - Système <strong>de</strong> <strong>consigne</strong> au Québec .................................................................. 187<br />
viii Rapport final Décembre 2011


