plan de gestion des matières résiduelles - MRC de Coaticook
plan de gestion des matières résiduelles - MRC de Coaticook
plan de gestion des matières résiduelles - MRC de Coaticook

You also want an ePaper? Increase the reach of your titles
YUMPU automatically turns print PDFs into web optimized ePapers that Google loves.
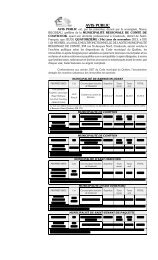
Tableau 4.21 Bilan <strong>de</strong> masse <strong>de</strong>s matières résiduelles en 2001<br />
Matières<br />
Quantité<br />
générée<br />
Quantité<br />
réelle<br />
récupérée<br />
Quantité potentielle<br />
pouvant être mise en<br />
valeur<br />
Taux effectif<br />
<strong>de</strong><br />
récupération 1<br />
PROJET DE PGMR DE LA <strong>MRC</strong> DE COATICOOK 52<br />
Objectif <strong>de</strong> mise en<br />
valeur<br />
Quantité à<br />
récupérer<br />
Tonnes Tonnes % Tonnes % % Tonnes Tonnes<br />
SECTEUR RÉSIDENTIEL<br />
Papiers/Cartons 1065 554 100 1065 52 60 639 85<br />
Verre 308 209 91,8 283 74 60 170 0<br />
Plastiques 629 94 17,3 109 86 60 65 0<br />
Métaux 411 64 95,6 393 16 60 236 172<br />
Sous-total recyclables 2413 921 - 1850 50 60 1110 257<br />
Matières putrescibles 2600 199 100 2600 8 60 1560 1361<br />
Huiles, peinture, pestici<strong>de</strong>s 34 7 75 26 27 75 20 13<br />
RDD 2 Autres RDD 11 5 75 8 63 60 5 0<br />
Textiles 270 103 100 270 38 50 135 32<br />
Fibres sanitaires 424 32 100 424 8 60 254 222<br />
Autres (à l’exclusion <strong>de</strong>s RDD) 667 334 - ≥ 334 - nd 334 -<br />
Total – Secteur rési<strong>de</strong>ntiel 6419 1601 - 5512 - 60 3084 1885<br />
SECTEUR INDUSTRIES, COMMERCES ET INSTITUTIONS<br />
Papiers/Cartons 2599 90,5 2352 53 70 1646<br />
Plastiques 717 90,5 649 12 70 454<br />
1857 3<br />
Métaux 1348 90,5 1221 73 95 1160<br />
1506<br />
Verre 119<br />
90,5 108 78 95 103<br />
Matières putrescibles 1284 9 90,5 1162 1 60 697 688<br />
Résidus <strong>de</strong> bois 2101 564 90,5 1901 36 70 1331 767<br />
Caoutchouc 6990 0 90,5 6326 0 60 3796 3796<br />
Autres 4785 0 90,5 4330 1 60 2598 2598<br />
Total – Secteur ICI 19 943 2430 90,5 18 049 13,5 - 11 785 9355<br />
(1) Le taux effectif <strong>de</strong> récupération, en relation avec les objectifs du gouvernement, correspond à : la quantité réelle <strong>de</strong> matières<br />
mises en valeur par rapport à la quantité potentielle <strong>de</strong> matières pouvant être mises en valeur.<br />
(2) Selon le bilan <strong>de</strong> Recyc-Québec (2000), le volume <strong>de</strong> RDD généré au Québec est <strong>de</strong> 18 600 tonnes ce qui équivaut à un taux <strong>de</strong> génération <strong>de</strong> 2,5 kg par personne<br />
par année (0,0025 t/pers/an). Selon la fiche d’information <strong>de</strong> Recyc-Québec sur les RDD (http://www.recycquebec.gouv.qc.ca/D_PDF/Marches/RDD%20sommaire.pdf),<br />
le taux potentiel <strong>de</strong> récupération est <strong>de</strong> 75%.<br />
(3) Métaux provenant <strong>de</strong> la collecte sélective et <strong>de</strong> la collecte au privé.<br />
nd = non déterminé