Monkerud, L. C. - Handelshøyskolen BI
Monkerud, L. C. - Handelshøyskolen BI
Monkerud, L. C. - Handelshøyskolen BI
- No tags were found...

Create successful ePaper yourself
Turn your PDF publications into a flip-book with our unique Google optimized e-Paper software.
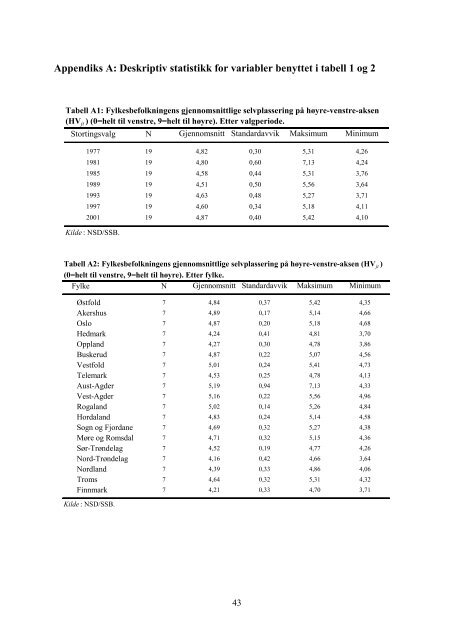
Appendiks A: Deskriptiv statistikk for variabler benyttet i tabell 1 og 2Tabell A1: Fylkesbefolkningens gjennomsnittlige selvplassering på høyre-venstre-aksen(HV jt ) (0=helt til venstre, 9=helt til høyre). Etter valgperiode.Stortingsvalg N Gjennomsnitt Standardavvik Maksimum Minimum1977 19 4,82 0,30 5,31 4,261981 19 4,80 0,60 7,13 4,241985 19 4,58 0,44 5,31 3,761989 19 4,51 0,50 5,56 3,641993 19 4,63 0,48 5,27 3,711997 19 4,60 0,34 5,18 4,112001 19 4,87 0,40 5,42 4,10Kilde : NSD/SSB.Tabell A2: Fylkesbefolkningens gjennomsnittlige selvplassering på høyre-venstre-aksen (HV jt )(0=helt til venstre, 9=helt til høyre). Etter fylke.FylkeN Gjennomsnitt Standardavvik Maksimum MinimumØstfold 7 4,84 0,37 5,42 4,35Akershus 7 4,89 0,17 5,14 4,66Oslo 7 4,87 0,20 5,18 4,68Hedmark 7 4,24 0,41 4,81 3,70Oppland 7 4,27 0,30 4,78 3,86Buskerud 7 4,87 0,22 5,07 4,56Vestfold 7 5,01 0,24 5,41 4,73Telemark 7 4,53 0,25 4,78 4,13Aust-Agder 7 5,19 0,94 7,13 4,33Vest-Agder 7 5,16 0,22 5,56 4,96Rogaland 7 5,02 0,14 5,26 4,84Hordaland 7 4,83 0,24 5,14 4,58Sogn og Fjordane 7 4,69 0,32 5,27 4,38Møre og Romsdal 7 4,71 0,32 5,15 4,36Sør-Trøndelag 7 4,52 0,19 4,77 4,26Nord-Trøndelag 7 4,16 0,42 4,66 3,64Nordland 7 4,39 0,33 4,86 4,06Troms 7 4,64 0,32 5,31 4,32Finnmark 7 4,21 0,33 4,70 3,71Kilde : NSD/SSB.43